Goodbye, 2020!
We wish you a happy holiday season and a much, much brighter New Year! 2021 should bring Covid-19 under control. Our seemingly endless battle with SARS-CoV-2, and with ourselves, will not go away easily, however, and we are still at the beginning of the war with Covid-19.
The indoor environment is the battleground, and today’s inadequate ventilation and air filtration standards are Covid-19’s primary weapon.
Four interrelated effects determine our path through the pandemic:
• Ventilation
• Vaccination
• Infection
• Luck (both good and bad)
As we wrote in our March 2020 news article, SARS-CoV-2 is an airborne disease. CDC and ASHRAE now acknowledge and agree with Build Equinox recommendations described in our May 2020 news article, however, they continue to leave the specifics of “increased ventilation” and air filtration unspecified. How much fresh air is needed? What air recirculation flow through improved filters is good? How much do face masks help? These are the specifics Build Equinox works to answer, and has for many years.
Anyone entering a building without knowing its air quality is playing Russian roulette with their health. Our noses cannot smell healthy, contagion-free air. The odor of disinfectant is no assurance of a virus-free space.
People in the US and many other countries are unfortunately acting in a divided manner. Some people are choosing to follow a pro-active path to protect themselves, their families and friends from the disease. Protective measures must continue for at least the first 6 months of the new year when “herd immunity” (aka, herd protection) through vaccination and recovered infection cases reach a level that dampens disease transmission.
The fraction of a country’s populace choosing to ignore precautions will follow the infection path. The vaccine protection path is the more economical path as well as the one that harms fewer people. Unfortunately, a significant number of people have decided that their 90% chance of experiencing minor symptoms outweighs consideration for the remaining 10% who will experience a debilitating illness and the 1% of a community who will die. The cost difference is enormous. As much as it seems that 15,000,000 and counting infections must be near the end, herd protection will not occur until 200,000,000 more people in the US are either vaccinated or infected. At $20 per vaccine dose, the cost for vaccinated herd protection is $4billion. Following the infection route, with 10% (20,000,000) of the infected population becoming severely ill (and 10% of those die), at $50,000 per severe illness, the cost of infected herd immunity is $1trillion. The real answer is somewhere between these levels, and our behavior determines whether we spend $4B or $1T.
Some of cautious folks and some callous folks will be lucky. Some of the luck will be good (careless folks who do not become infected) and some of the luck will be bad (cautious folks who are infected). Spectacular news of multiple, highly effective vaccines provide hope for the new year that those who choose to be vaccinated can avoid the disease’s devastation.
How does vaccination and immunity from infection recovery combine to create the so-called “herd immunity”. The herd immunity concept is a statistical description rather than an individual one. Herd immunity signifies the condition where a disease is no longer self-propagating, however, outbreaks will continue to occur. One group can get “heads” 100 times in a row while another can toss 100 “tails” in a row. Overall, the probability is still 50% heads and 50% tails.
Like tossing a coin, one building can inhibit disease transmission while another indoor space encourages transmission even though a community has reached herd immunity. Your health doesn’t have to be a coin toss. Following our guidelines for fresh air (800ppm carbon dioxide concentration), air recirculation through MERV13 filters, wearing face masks, and distancing creates a situation where you are not gambling with your health.
The table below from our May guidelines article shows how carbon dioxide concentration from respiration is related to fresh air flow through an indoor space. A house may have an average carbon dioxide concentration of 800ppm, however, if the occupied space is at 1200ppm and the unoccupied space is 400ppm, the occupants are at higher risk. Note that 1200ppm, typical of indoor spaces at today’s standard ventilation rates, has half the fresh air flow (20cfm per person of fresh air flow) as our recommended 800ppm with 40cfm of fresh air per occupant.
The building schematic below shows a generalized model Build Equinox has developed for assessing the effects of vaccination and infection on susceptible persons. Included in the model are the effects of two air recirculation systems (eg, the building ventilation system and a localized space filtration unit). The model includes the impact of human behavior (ie, wearing face masks).
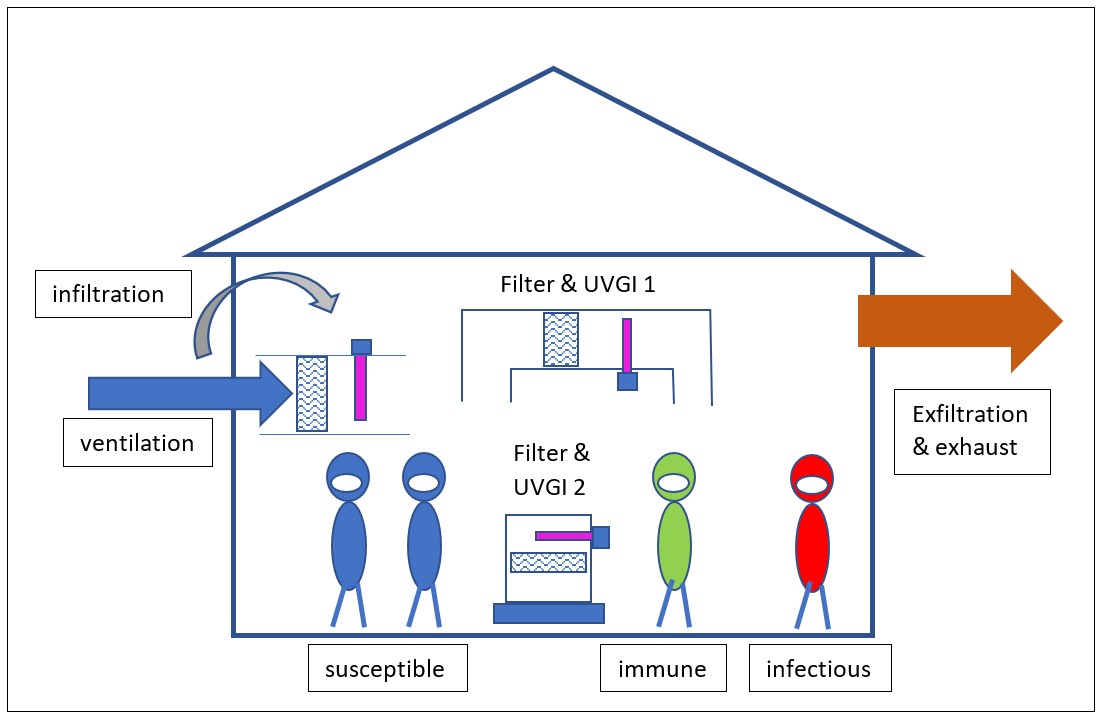 Schematic of general model for predicting probability of SARS-CoV-2 infection and determining if the disease is self-propagating based on fresh air ventilation, air recirculation filtering and UVGI, face mask usage, susceptible people, infectious people, and immune people.
Face masks are important for two reasons:
1) Reduction of contagion emitted by contagious persons
2) Filtration of contagion inhaled by susceptible persons
Note that contagion filtration efficiencies of exhalation and inhalation can be different. Also, if an ideal face mask had been developed in parallel with vaccines, all airborne contagion could be removed and killed before a susceptible person inhaled it. How could sophisticated vaccines be developed, but high performance N95 masks are still not available after 9 months?
Several figures below display the probability of a susceptible person becoming infected, and the very important “building Reproduction number” (building Ro). These terms are discussed in our original March article on Covid-19 and airborne disease transmission. While we may be most interested in our chance of getting infected, Ro is more important because it indicates when we reach herd immunity. Ro is the ratio of people infected per infectious person, and when Ro is less than 1, a disease is no longer self-sustaining. Ro is not a constant value even though you may hear that it has an average value of 2 to 3. Our habits, the building environment, the weather and other factors impact Ro.
 Probability of infection in a building versus carbon dioxide concentration for 1 hour exposure. No air recirculation filtering and sanitizing (UVGI) assumed with 5, 10, and 100 occupants (with 1 occupant infectious and all others susceptible). Note that standard ventilation (1200ppm, or 20cfm fresh air per occupant) is 50% more likely to infect people than 800ppm (40cfm per occupant). More importantly, note that Ro for 800ppm is less than 1 while 1200ppm is greater than 1, indicating self-sustained disease propagation.
 Recirculating air at 25cfm per occupant through a MERV 13 filter reduces infections and reduces Ro below 1 for a 1 hour exposure time. The cost for added fresh air (without energy recovery) is a penny per hour of occupancy when it is freezing outside, and you are worth a penny per hour! The cost for air recirculation and improved filtration? Less than a penny per hour of occupancy.
 These plots show an 8 hour exposure time with no air recirculation and filtration. 800ppm significantly reduces probability of infection compared to standard (1200ppm) ventilation, however, the disease remains above 1.
 Adding 25cfm per person of air recirculation through a MERV 13 filter significantly reduces probability of infection over an 8 hour exposure time, however, building Ro continues to remain above 1 at self-sustaining disease transmission levels.
 An 8 hour exposure with occupants wearing face masks with 50% exhalation filtration capture of contagion from infectious persons and 50% inhalation filtration of contagion by susceptible persons in the room, coupled with 25cfm per occupant of air recirculation through a MERV 13 filter further reduces the chance of becoming infected and reduces building Ro below 1 (self-sustained transmission) at 800ppm carbon dioxide concentration.
  75% occupant immunity (sum of vaccinations and recovered immunities) does not reduce your chance of becoming infected if you’re susceptible, however, the building Ro is reduced. The above case assumes 8 hour exposure time with air recirculation at 25cfm per person through a MERV 13 filter.
Plots showing a susceptible person’s infection probability and the building Ro are shown for the following cases:
1) 5, 10, and 100 occupants with 1 infectious occupant during 1 hour exposure time. Infection probability and building Ro are shown versus indoor air carbon dioxide concentration (800ppm = 40cfm fresh air per occupant; 1200ppm = 20cfm fresh air per occupant).
2) Same as Case 1 with 25cfm per person air recirculation through a MERV 13 filter
3) Same as Case 1 but for 8 hour exposure time
4) Same as Case 2 but for 8 hour exposure time
5) Same as Case 4, but with face masks usage that reduces exhalation contagion from infectious persons by 50%, and 50% contagion inhalation filtration for susceptible persons, similar to today’s cloth/paper masks
6) Same as Case 4 but 75% of occupants are immune from vaccinations or recovered infections.
The series of cases can be summed up as follows: doubling fresh air ventilation from today’s standard ventilation significantly reduces your chances of becoming infected if an infectious person enters the space. More importantly, increased fresh air ventilation can reduce contagion transmission below self-sustaining levels at low exposure times (1 hour). Adding air recirculation through a MERV 13 filter at 25 cfm per occupant further reduces both probability of infection and transmission replication. Lower Ro’s speed the decay of disease transmission.
8 hour exposure time periods, such as in the workplace, school or home, rely on face mask usage in combination with increased fresh air and improved air recirculation filtration to drop infection transmission to non-sustaining levels.
Self-sustained disease transmission is reduced as immunization increases, however, the probability of infection for susceptible occupants stays the same. A susceptible (unimmunized) person in a room with 5 occupants (1 infectious person) has the same probability of becoming infected whether or not the other 3 people are immune or susceptible.
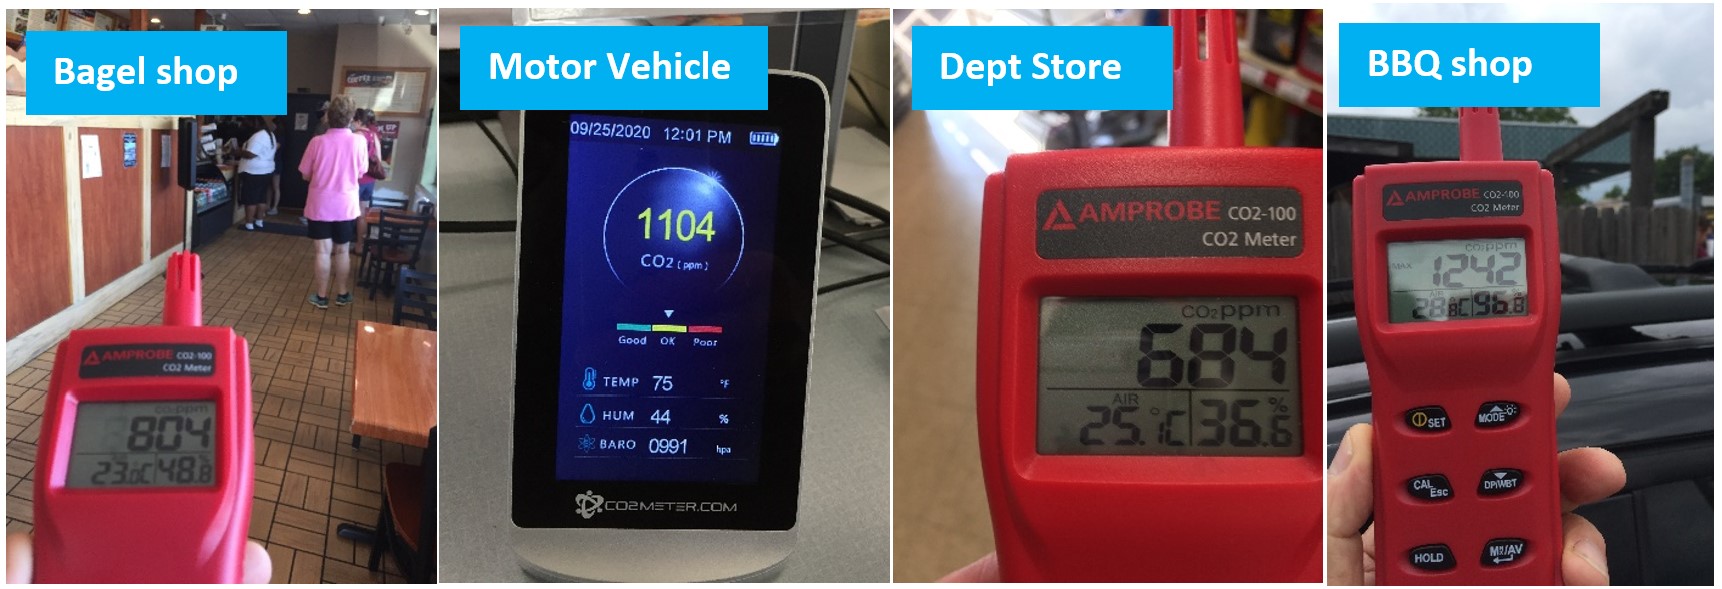
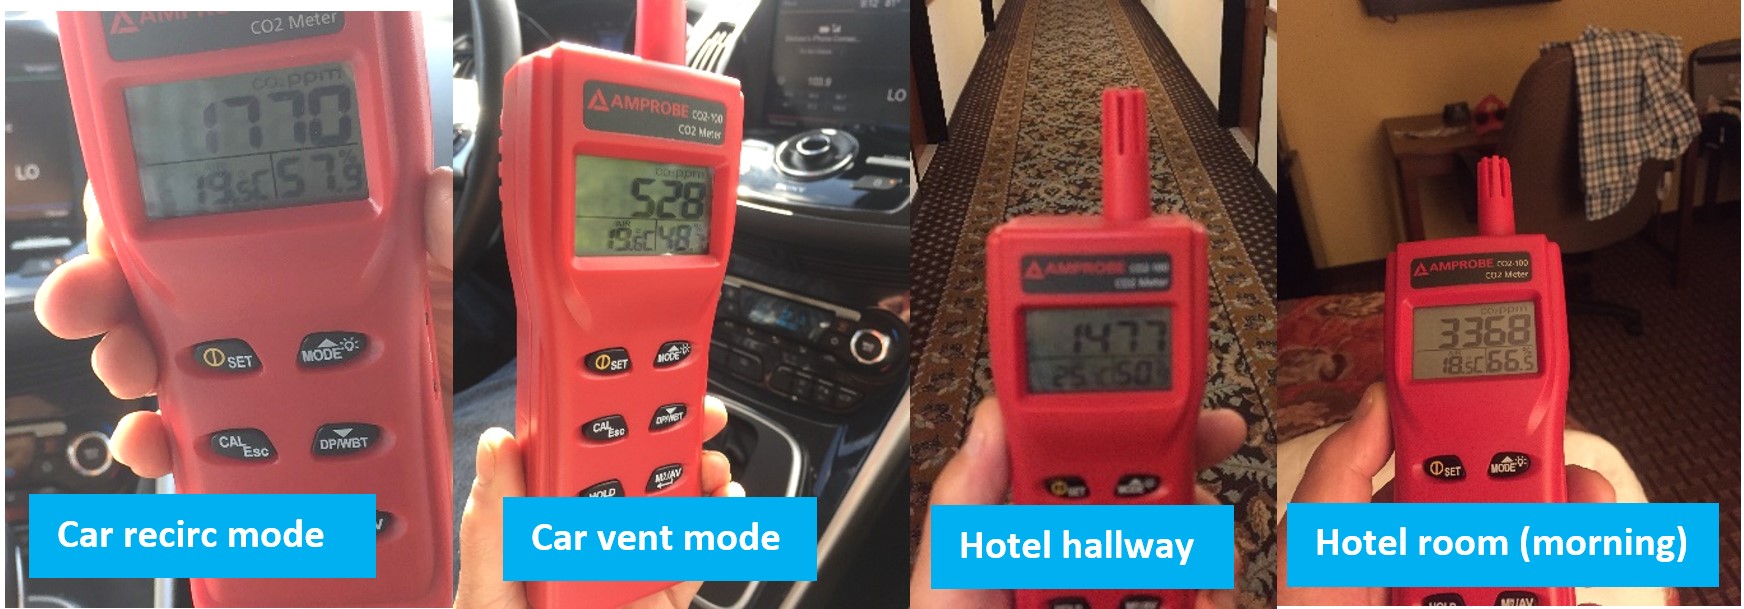
What are typical carbon dioxide levels in real buildings? We have been measuring carbon dioxide in many different situations for many years. Over the past year, an army of CO2 monitoring folks have been sending us pictures of places they visit (church, massage therapist, department stores, food pickup, etc). The 12 representative photos show CO2 levels above 1000ppm are prevalent (8 out of 12 situations shown). And, you could safely wager a few beers that recirculation filtration in these venues is poor or non-existent.
 Carbon dioxide concentration readings in several venues. Do you think your nose can tell you which ones have sufficient fresh air? Are you willing to risk your health on it?
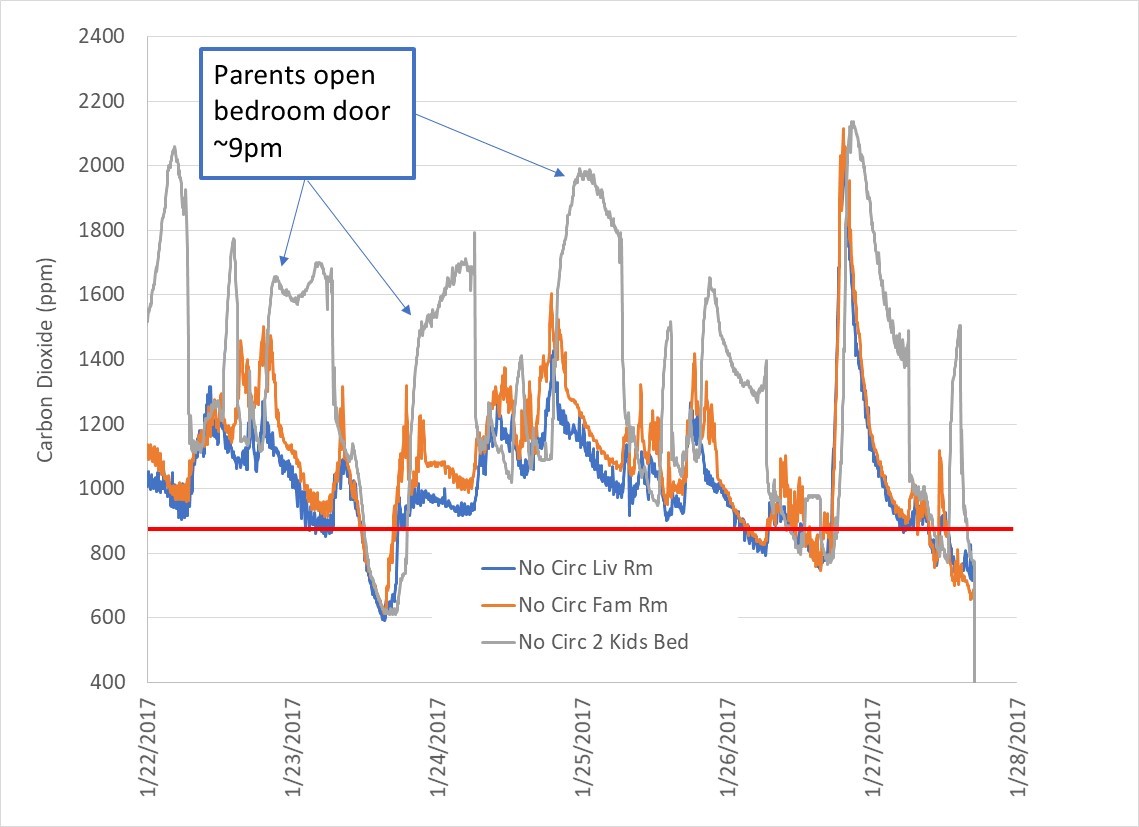
Following the CO2 photos are a series of carbon dioxide plots from different indoor environments. “Leaky”, older homes and high performance Passive House homes that meet today’s ventilation standards have poor carbon dioxide levels that efficiently transmit SARS-CoV-2 and influenza virus, as well as impair cognition and degrade sleep.
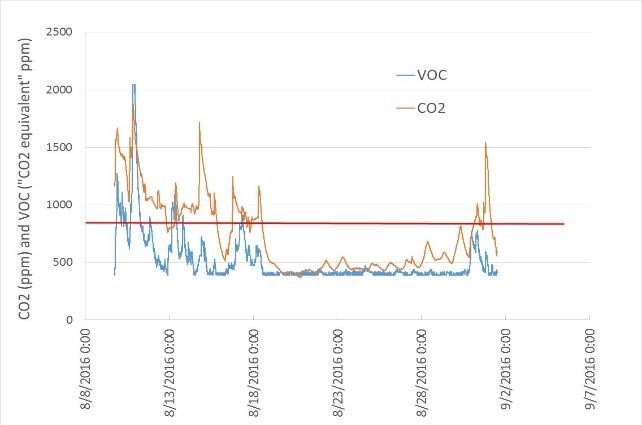 Carbon dioxide in certified Passive House is just as poor as in the leaky, 1950’s house because of inadequate ventilation standards (0.3ACH). Excessive pollutants when occupied and over-ventilated when unoccupied.
 What’s the air quality at your workplace? Is a penny per hour per employee too much to keep people healthy? This 120 employee business has loss productivity and extra sick days because of poor IAQ.
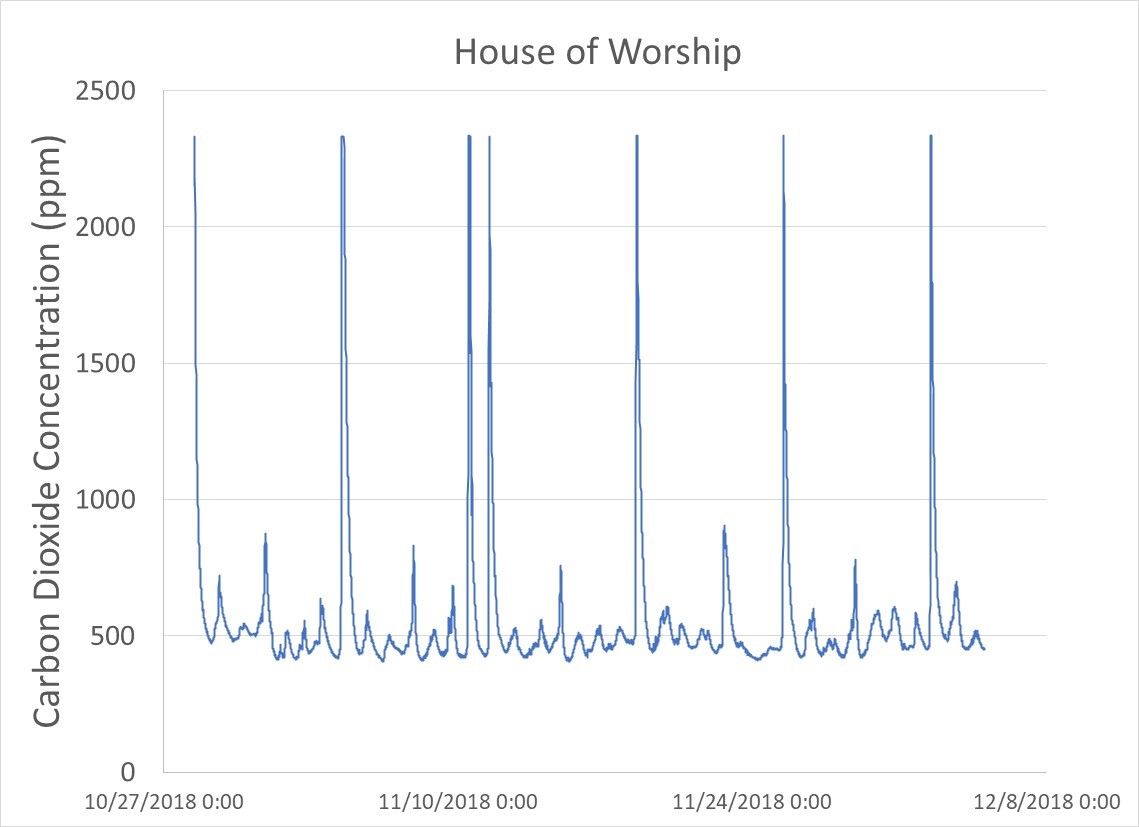 House of worship gatherings are often not designed for proper ventilation during worship services, resulting in Covid-19 super-spreading.
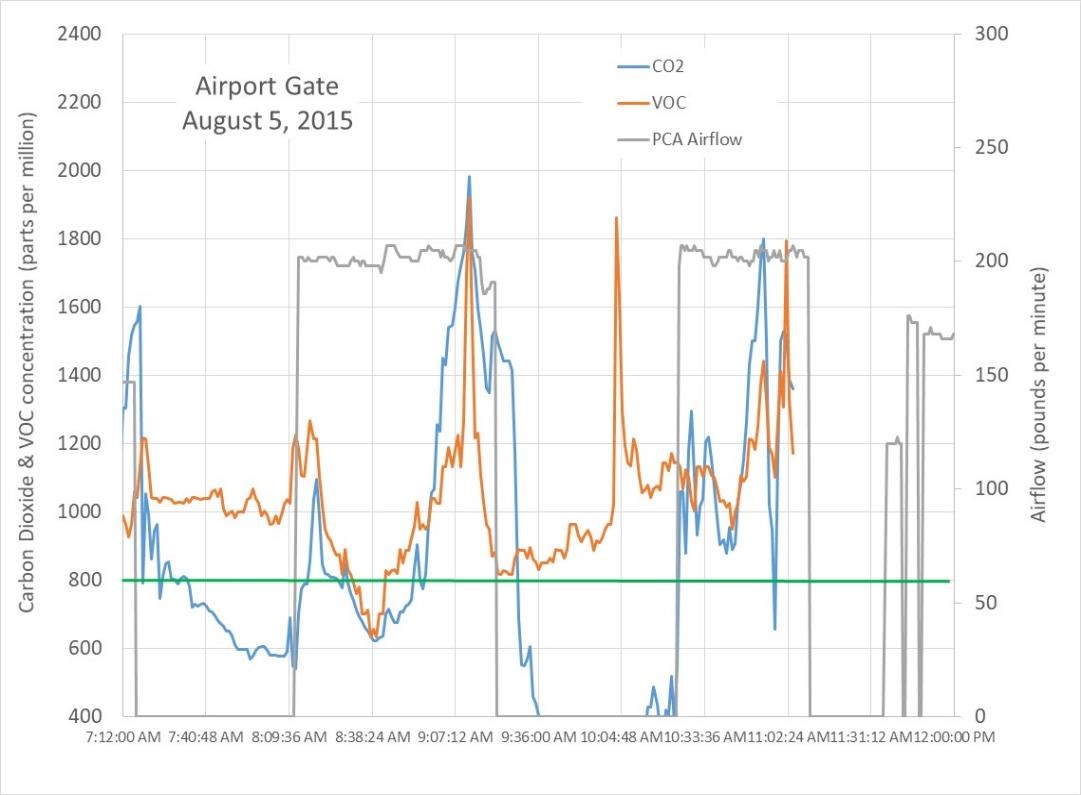 Airline boarding bridges, such as this one at a major US airport, often have very poor ventilation. Loading has worse IAQ than unloading periods. And the aircraft not much better despite what airline CEOs state. Airlines; measure your carbon dioxide and display it to us!
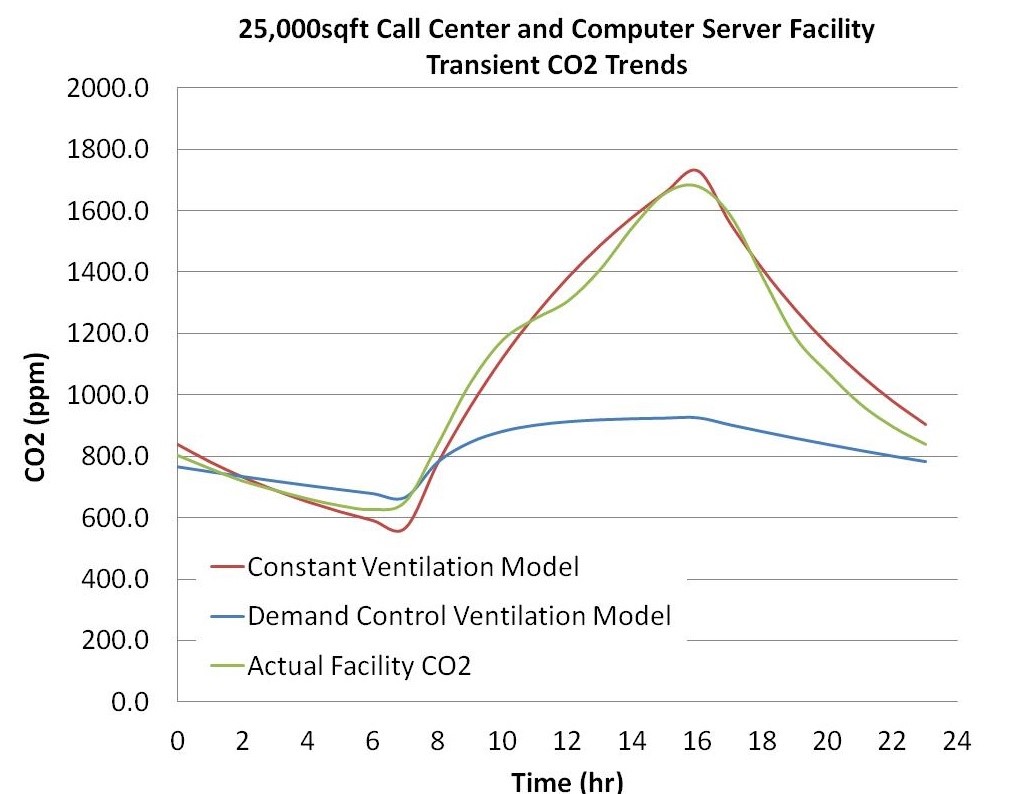
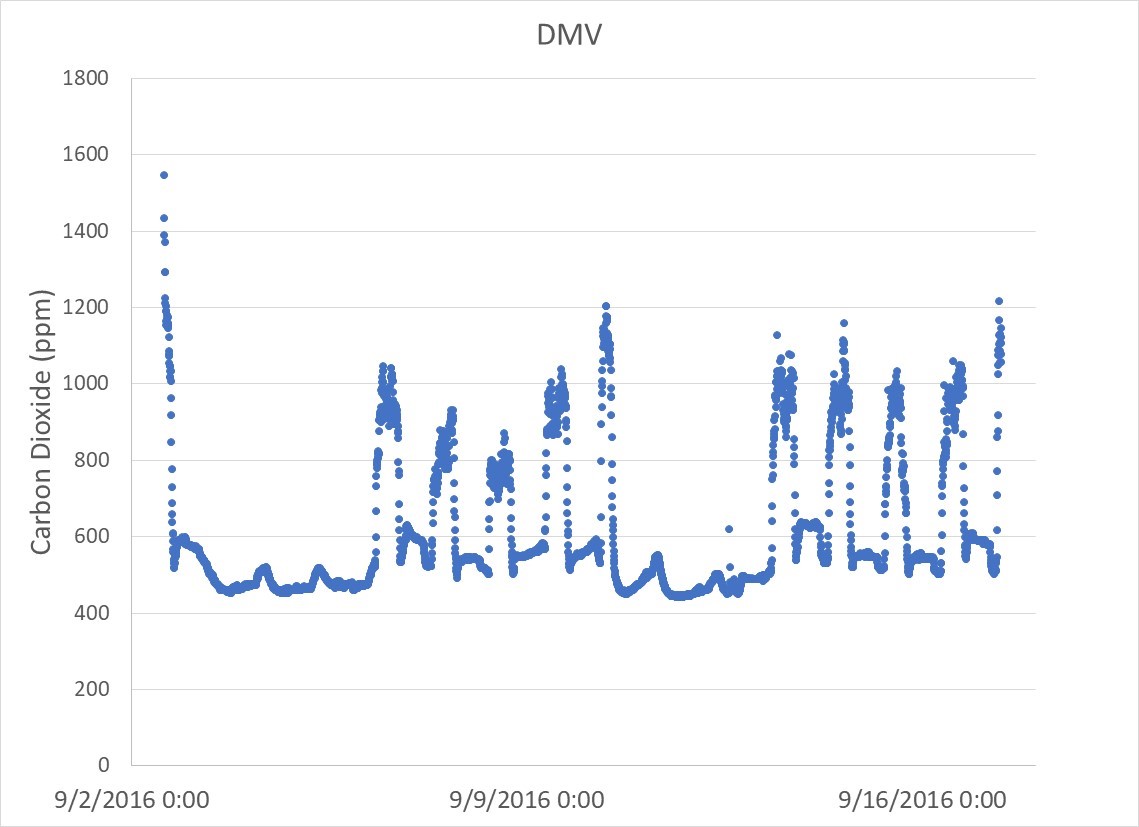 An Illinois Department of Motor Vehicles (DMV) building with DCV (Demand Control Ventilation) that increases fresh air when carbon dioxide concentration increases above 1000ppm.
Office environments, houses of worship, and transportation centers have dynamic changes of air quality that require smart technologies to maintain a healthy indoor environment. The Illinois Department of Motor Vehicle facility plot shows how a DCV (Demand Controlled Ventilation) system responds to occupancy loading automatically. The carbon dioxide setting is too high per our guidelines, but the ability to change air quality is a simple movement of a dial.
Is our 800ppm too drastic of an increase in fresh air ventilation? Is saving a Btu more important than saving a life? How much does 800ppm ventilation control cost? Why not 1000ppm (~30cfm per occupant)? Our May guidelines provides background information and references for 800ppm fresh air ventilation. We listed two primary factors to set this standard. First, the study by Milton and colleagues (see reference on our website) with over 3000 employees scattered among several building environments demonstrated a 40% reduction of sick days in the workplace by doubling today’s ventilation standard, which is equivalent to the efficacy of the influenza vaccine. Although Covid-19 and the flu are two very different diseases, their transmission characteristics are similar (Ro ~2 to 3 on average). Second, cognition studies (see two TH Chan School of Public Health, Harvard University references on our website) indicate significant human productivity cost benefits with doubling today’s fresh air ventilation rates.
We do not know if 800ppm is low enough for Covid-19, however, 1000ppm was found in one study to be insufficient. A Dutch nursing home had rampant SARS-CoV-2 transmission in a carbon dioxide ventilation-controlled building with 1000ppm setpoint. The building did not have recirculation filtration of air as we recommend. As indicated by our prediction results, 1000ppm is expected to cause self-sustained disease transmission.
The cost? If it is freezing outside (32F or 0C), the utility cost for doubling fresh air is a penny per occupant hour! Although energy efficiency is important, your health is more important. IAQ is very dynamic. When you’re home, you need fresh air. Wherever you go and whatever you do, you must have fresh air. You need 10 times more fresh air when you’re exercising than when you’re asleep. As displayed in the carbon dioxide plots below, air quality is more complex than heating and cooling. In the new year, a new building design paradigm is needed, one in which all buildings place human health, well-being and productivity first among all other considerations. And that’s why we’ve developed CERV2 smart ventilation technologies. To provide a piece of mind and remove stress and worry about your indoor environment so you can be busy enjoying life!
