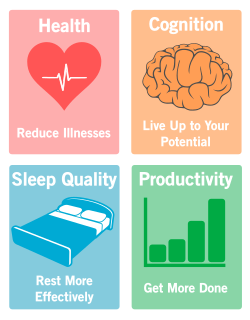
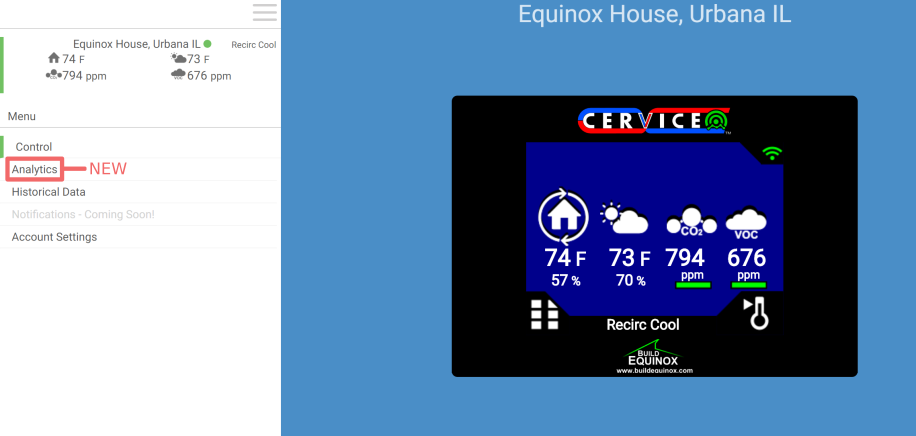
 The CERV® smart ventilation system is the world’s first automated residential air quality management system. With CERV-ICE, our online internet monitoring and control system, Build Equinox has formulated a set of “Analytics” or metrics to provide the CERV Community members with a better means for understanding how varying levels of air quality impacts our health, cognition (brain health) and productivity. CERV-ICE archives all CERV data from the instant it is activated, with no fees, no subscriptions, and no pop-up advertising!
Our new Analytics is a start toward our grand vision of helping us to feel good. We have developed three sets of metrics that CERV-ICE users have direct access to anytime through any online interface.
1) Personal metrics
2) Exposure metrics
3) Basic metrics
Personal metrics are those effects that are of immediate importance to our feeling of well-being and cognition performance. Recent research has demonstrated that elevated carbon dioxide levels immediately affect our brains and impairs several important areas of cognitive performance. In a similar manner, our performance as well as our health is impacted by elevated levels of VOCs. We have much to learn about both carbon dioxide and VOC impacts as well as their combined impacts, however, we know enough at this time to provide quantitative estimates of how varying levels of carbon dioxide and VOCs will affect our performance.
We define a performance scale for personal metrics relative to a human’s performance at a “decipol” of ventilation, roughly the level of ventilation that today’s building standards are based on. A decipol is 10 liters per second per person (or, approximately 20 cubic feet per minute per person). At this level of ventilation, a recently showered human with clean clothing at sedentary activity (office work) who outputs an “olf” of pollution creates air quality that dissatisfies 20% of the general populace. More importantly, at this level of air quality, the resulting 1000 to 1100ppm concentration of carbon dioxide degrades cognitive performance by almost 15% relative to concentrations approaching outdoor air conditions. Note that for someone with annual earnings of $50,000 per year, a 15% cognition degradation has a value of $7500 per year.
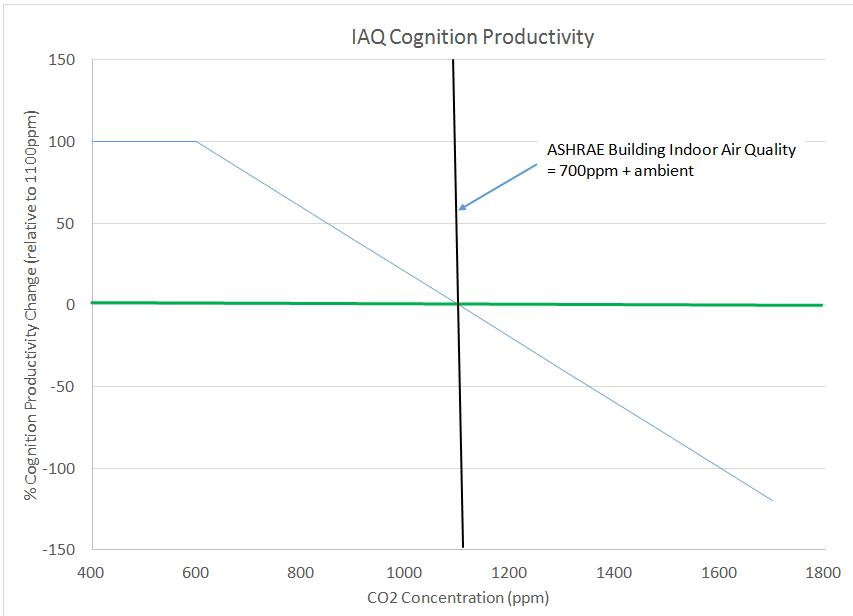
We assign 0% of cognition improvement to an indoor atmosphere with 1000ppm of carbon dioxide, with a linear scale increasing to 100% of the maximum achievable cognition improvement (that is, 100% of the 15% cognition performance gain) at 600ppm of carbon dioxide. Carbon dioxide concentrations below 600ppm (down to atmospheric carbon dioxide level of 400ppm) level off at 100% of the potential improvement. Carbon dioxide concentrations greater than 1000ppm continue as a linear extrapolation with negative cognition impact based on research that indicates approximately linear degradation of cognition capability as carbon dioxide increases to 2400ppm.
The same scale weighting is used for our total VOC sensor. The CERV’s total VOC sensor output is correlated to a human’s carbon dioxide output. That is, a human’s mixture of emitted VOCs relative to the human’s carbon dioxide is assigned the same concentration level. A room with a human that registers 1000ppm of carbon dioxide also registers 1000ppm of VOCs when human emission of VOCs is the only source.
We interpret the VOC reading as a measure of “health” because VOCs do impact our health, but at the same time, we recognize that VOCs can also contribute to our mental capability. For example, Fanger (“What is IAQ”, see our review in our August 2016 newsletter) cites a study that links allergies to VOCs and ventilation level. With this in mind, a 0% health improvement is assigned to a total VOC reading of 1000ppm while a total VOC reading of 600ppm or less is assigned an air quality improvement of 100% above that of current ventilation standards. Negative health related air quality levels occur when total VOC levels are greater than 1000ppm.
Our third personal metric is related to sleep quality. Research has demonstrated that sleep is negatively impacted by increased levels of carbon dioxide. Poor sleep, as well as a possible “carbon dioxide” hangover degrades human productivity the following day. For our sleep scale, we use the CERV’s carbon dioxide readings with same linear scale as used for cognition performance, but restrict the analysis to nighttime hours (10pm to 7am) when home occupants are likely to be sleeping.
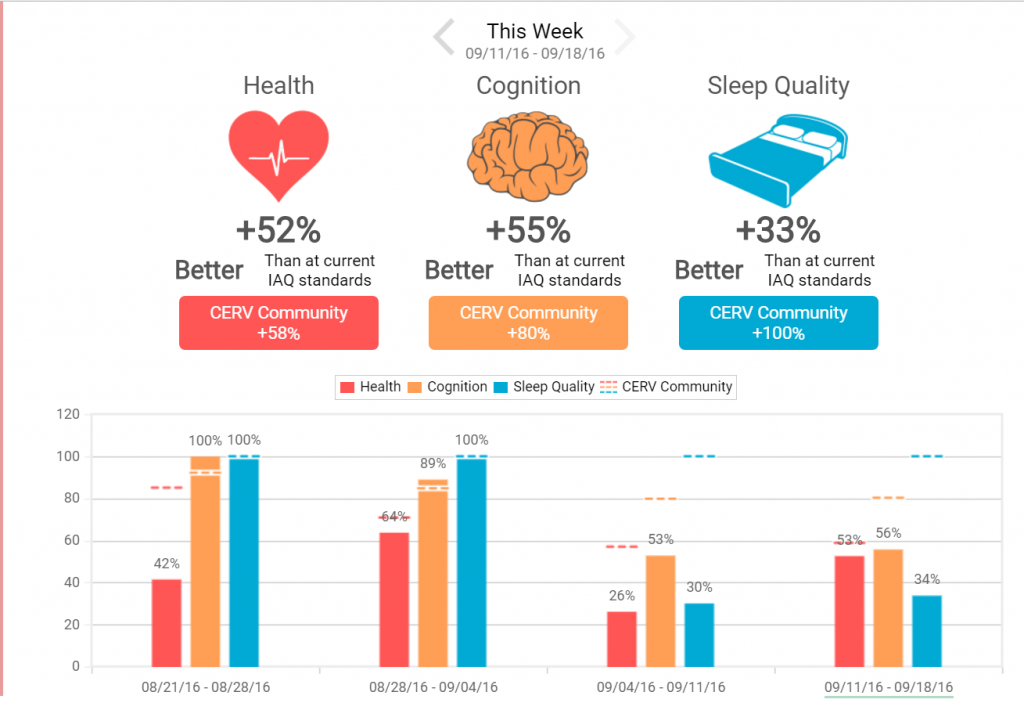
Figure 1 is a sample of the personal metrics page from the CERV-ICE Analytics section. Four weekly levels of the metrics are shown. The top portion displays one week from the four most recent weeks of data. Scroll arrows allow CERV Community members to move to any of the four latest weeks. Values of the CERV Community average for each of the readings are also provided, similar to neighborhood averages often incorporated into one’s monthly utility bill. A set of four bar charts lists the same information for the four weeks in order to identify trends.
The second Analytics section provides details of pollutant exposure. We know that over long periods of time, our exposure to seemingly harmless levels of pollutants may evolve into serious impacts on our physical and mental health. CERV Analytics tracking of pollutant exposure will allow members of the CERV Community to build up a history of their home environment. As future health concerns develop, this data may be helpful.
We have developed three pollutant exposure scales:
1) Carbon dioxide-hours/day
2) VOC-hours/day
3) Total Pollutant-hours/day
The carbon dioxide and VOC scales are similar. We normalize the CERV’s carbon dioxide and VOC readings relative to atmospheric concentration level (400ppm) and an assumed level of pollutant concentration exposure of 1000ppm due to an olf of human pollutant emission diluted with one decipol (10liters/second-person or 20cfm/person) of ventilation. A linear exposure scale with zero exposure at 400ppm is defined such that at 1000ppm, one hour of exposure at this concentration level results in 1 pollutant—hour of exposure. If the pollutant concentration remains at 1000ppm for a day, the daily exposure would be 24 pollutant-hours/day.
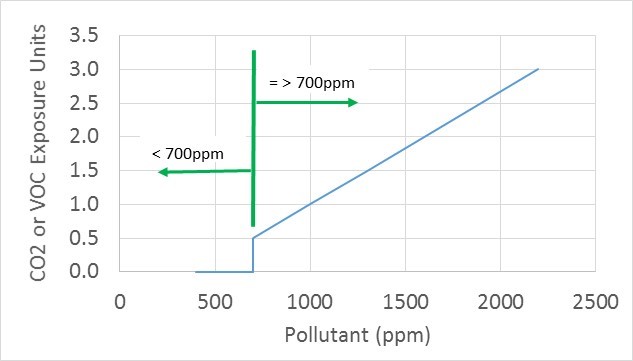
Figure 2 shows the normalized pollutant exposure scale plotted against pollutant (CO2 or VOC) concentration. Pollutant concentrations below 700ppm are defined as contributing zero exposure units while pollutant concentrations of 700ppm contribute 0.5 pollutant exposure units. At the present, we do not know the lower limit of pollutant exposure. Additionally, we do not know if the scale is linear or should have some non-linear curvature. We have defined these scales in a manner that will allow us to easily revise as research better defines these trends.
We know that CO2 and VOCs combine in some manner to impact us in some compounded manner, but as we are at the very initial stages of understanding these impacts, we define a combined pollutant exposure that provides a reasonable rationale for combining pollutant effects in a manner that can be further improved as more research data becomes available. Our “Total pollutant-hours/day” is formulated as the sum of two independent vectors. That is, we take the square root of the sum of the squares of the CO2-hours/day and the VOC-hours per day. Therefore, a home with 24 CO2-hours/day and 0 VOC-hours/day has a pollutant exposure of 24 Total pollutant-hours/day. Similarly, a home with 24 VOC-hours/day and 0 CO2-hours/day also has 24 Total pollutant-hours/day. A home with 17 CO2-hours/day and 17 VOC-hours/day also has 24 Total pollutant-hours/day.
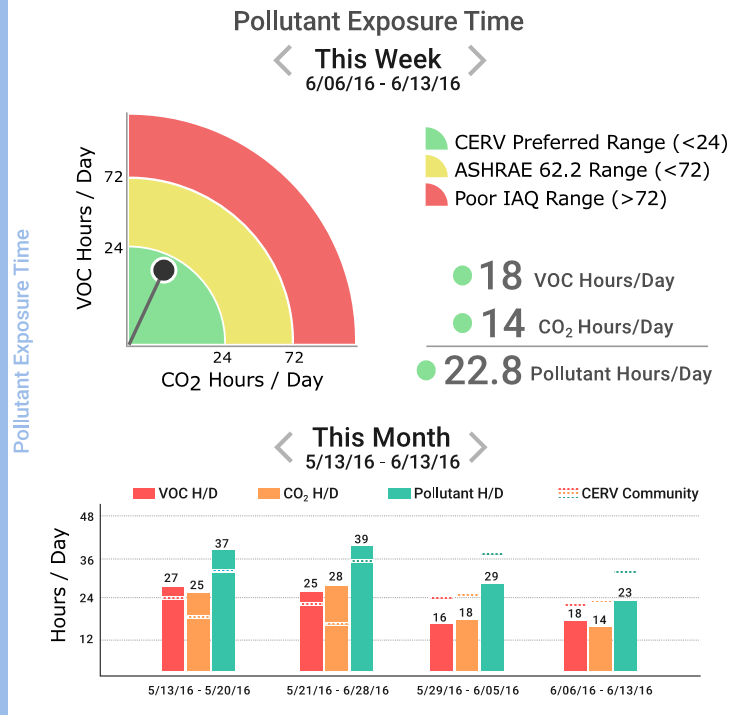
Figure 3 displays a radial plot showing our recommended range for home air quality (< 24 Total pollutant-hours/day). From the ASHRAE 62.2 ventilation table, a fully occupied home with ventilation as prescribed could accrue as much as 72 Total pollutant-hours/day. We show the range between our recommended upper limit and 72 Total pollutant-hours/day as yellow, with air quality exposure above 72 Total pollutant-hours/day as being unacceptable and shown in red. Also shown in Figure 3 are bargraphs of weekly averages of VOC-hours/day, CO2-hours/day and Total pollutant-hours/day. CERV Community average pollutant hours per day are also marked on the bargraphs. Note that one can scroll through the most recent four weeks of pollutant exposure readings on the radial plot in order to follow the progression over the past month.
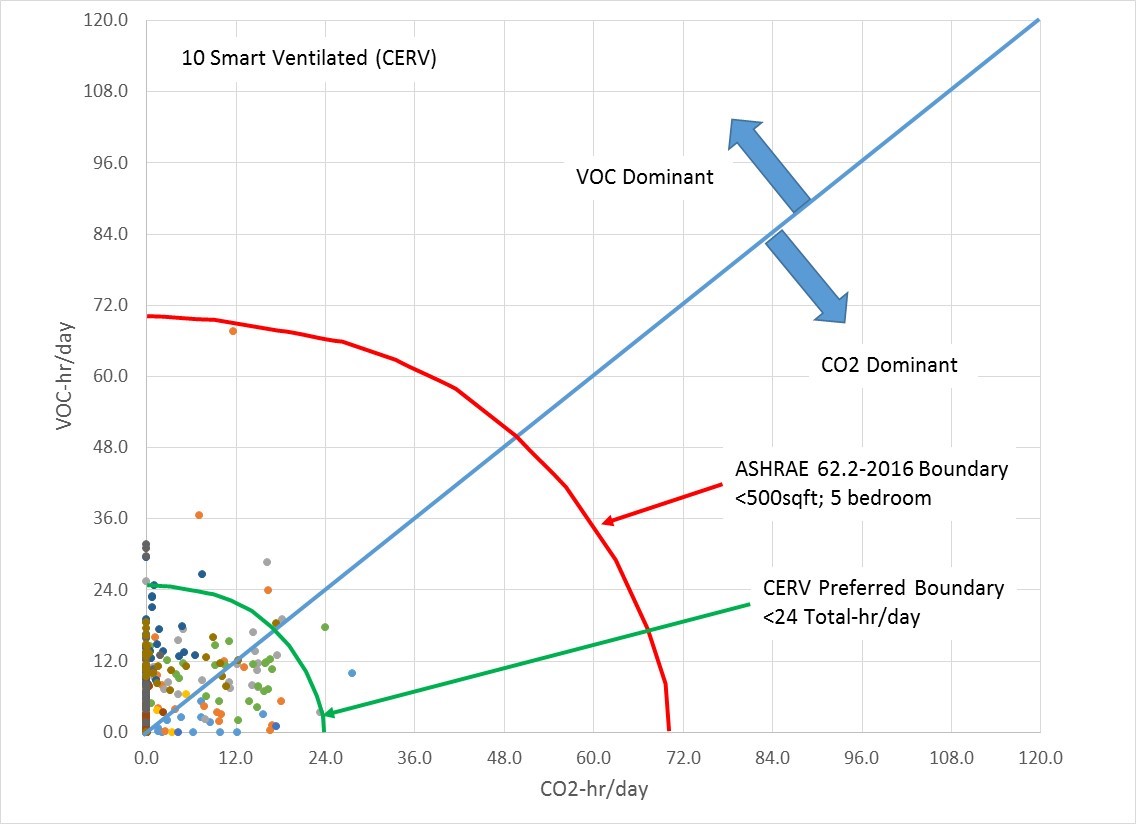
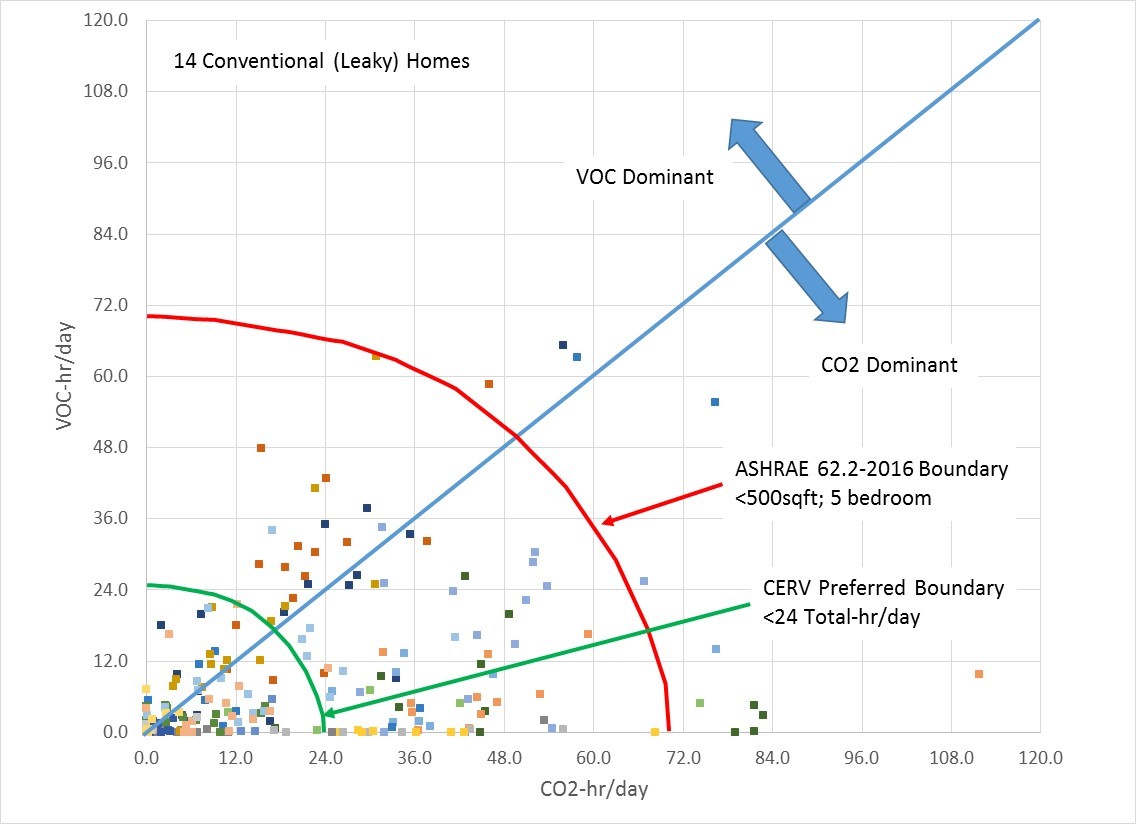
Figures 4 and 5 display real daily pollutant exposure data. Figure 4 presents pollutant exposure data from 10 CERV smart ventilated homes plotted on the radial pollutant-hour per day scale. The CERV homes are high performance homes with low infiltration rates that must have effective fresh air ventilation. The data is from the first two weeks of January which is a time when many homes are tightly sealed against winter conditions. The data points that exceed our recommended upper air quality limit of 24 Total pollutant-hours per day are from New Years Day weekend and the following weekend when some of the homes most likely had higher than normal cooking, parties, and visitors in their homes. The so-called leaky homes in Figure 5 displays the false nature of the common myth that leaky homes have good air quality. These homes have blower door infiltration test levels of at least 6 to 10 air changes per hour at 50 Pascals. Even though quite a bit of air is rushing through these homes, the occupied portion of the homes is often not in the path of the infiltrated air, leaving bedrooms, living rooms and other occupied areas with poor air quality. Designing an effective duct distribution system is essential for properly distributing fresh air to all areas of a home.
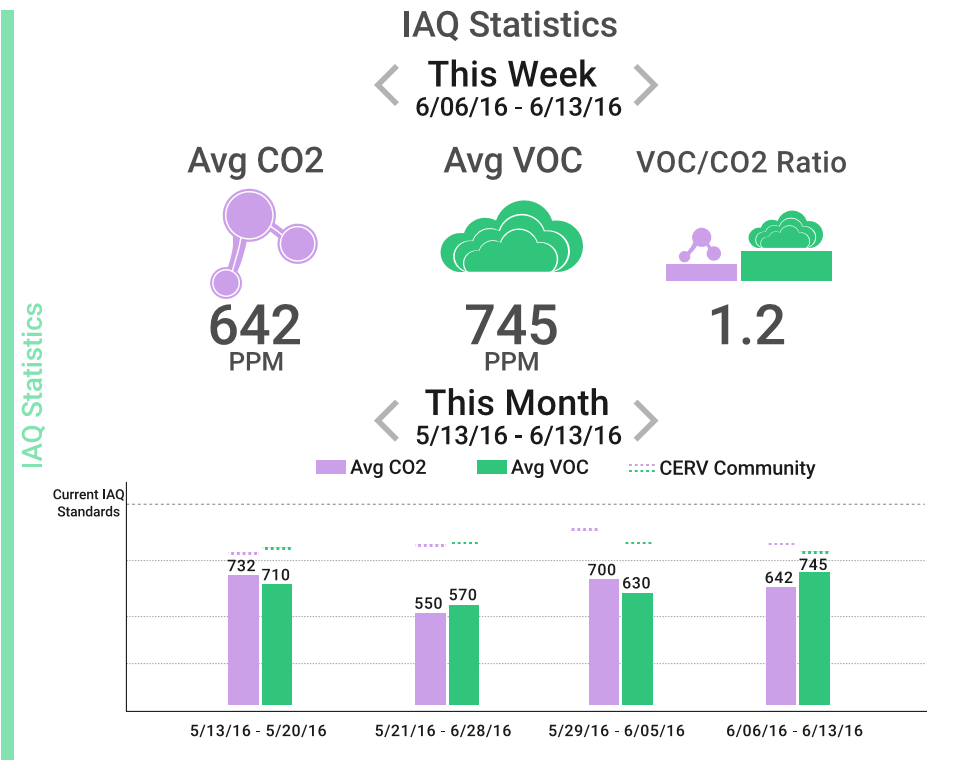
Our last CERV Analytics metric is shown in Figure 6. A display of the weekly average CO2 and VOC concentrations over the past four weeks and the ratio of VOC concentration to CO2 concentration are included in the section. The basic statistics section provides raw pollutant concentration information that has been used in computing personal metrics and exposure metrics. The ratio of VOC to CO2 concentrations provides some understanding as to whether a home is dominated by human emitted pollutants or non-human pollutant emissions. In an all-electric home, if the only source of pollutant emission human respiration and metabolism, CO2 will tend to dominate and the VOC to CO2 ratio will be less than 1. Even though our VOC sensor is calibrated to human VOC emission in a manner correlated to a human's CO2 output, leading to an ideal ratio of 1, VOCs breakdown and can be absorbed in building materials which leads to a faster decay of VOC pollutants relative to CO2 that is primarily reduced through fresh air dilution. When the VOC to CO2 ratio is greater than 1, other sources of VOC emission are present, such as cooking odors, cleaning chemicals, offgassing from furnishings, etc. In homes with combustion sources such as gas cooking or smoking, either CO2 or VOCs may dominate. In general, indoor combustion sources (cooking, fireplaces) increase indoor pollution levels many times above that of human and carefully selected building material pollutant emissions.
This is not the end, but the beginning of our journey to continuously improve our health and feeling of well-being in our homes. If you are already part of the CERV Community, watch for new developments as we continue our research and monitor the research results of others. We hope our relation with you doesn’t end with your purchase and installation of your CERV. If you are not a member of the CERV Community, you can still follow CERV Analytics and live monitoring of our Equinox House located in Urbana Illinois. And as always, your comments and questions are appreciated!

