We must ensure that indoor environments do not make us sick with our own human pollutants. A human sealed in a sanitized box with insufficient fresh air ventilation creates an unhealthy indoor environment polluted with toxic chemicals, particulates, and microbes generated by us! Fresh air must be delivered to every occupied indoor space and in addition, indoor air must be recirculated through filters (MERV 13 or better) for particulate and microbe management.
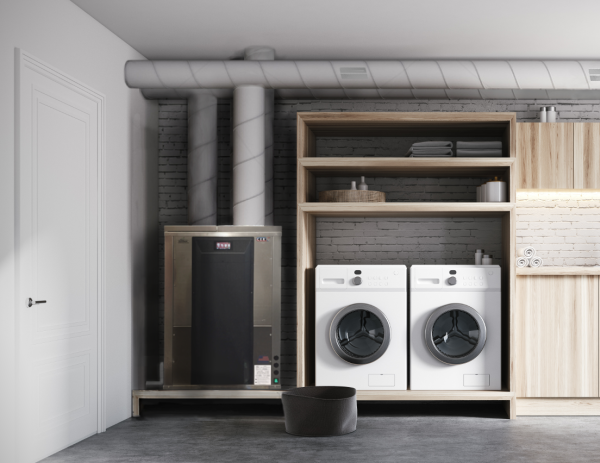
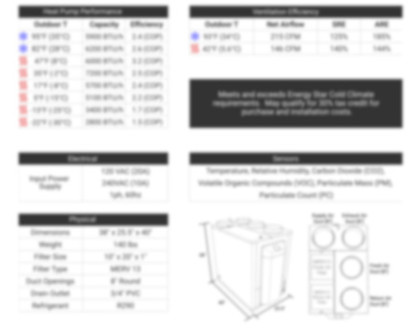
The only IAQ management system designed from its inception in 2007 to automatically manage human pollutants was the CERV (pronounced “serve”) and today’s second generation CERV2 (“serve-2”). Today’s HRV and ERV units are ventilators that are not designed for IAQ management, just as the horse-and-buggy carriage was not designed to be an automobile.
Pogo cartoonist Walt Kelly created a special comic strip for the initial Earth Day in 1970, with a reworded version of Commodore Perry’s famous statement. Pogo, trying to walk through piles of garbage and waste states, “We Have Met the Enemy, and He is Us!” We still have much to do, if not more than in 1970, to clean the outdoor environment.
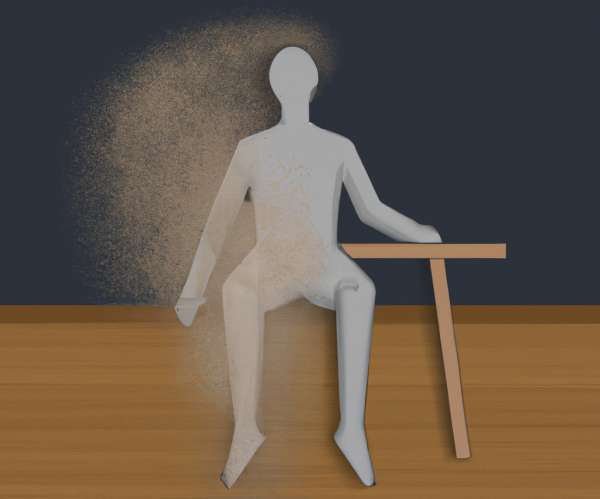
Indoor environments are in equal need of improvement. The primary source of indoor air pollution, ironically, is us. Air quality improves when humans are removed from indoor environments! Even a recently washed, clean clothed, quietly seated individual pollutes a room, filling it with carbon dioxide, several gaseous chemicals (VOCs, Volatile Organic Compounds), particulates, and microbes. As human activity increases, all of these pollutants are released at greater rates.
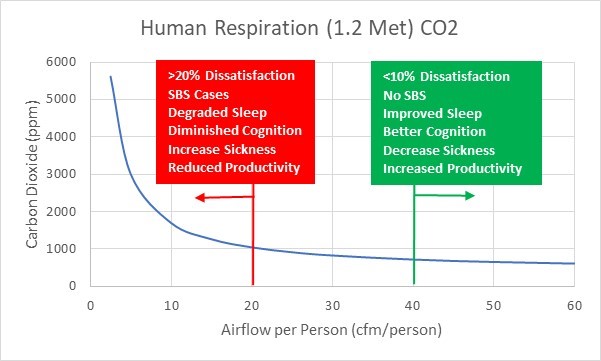
Our breathing produces a large volume of carbon dioxide, which is toxic at high concentrations. Odorless CO2 kills an individual in a sealed room before oxygen is depleted. Over the course of 24 hours, we exhale about 20 cubic feet (about ½ cubic meter) of carbon dioxide from our respiration. Figure 1 is a plot of CO2 concentration in a room with varying levels of fresh air flow per person.
Dozens of VOCs are released by our breathing, with acetone, ethanol, methanol, isopropanol and isoprene as the most prominent chemicals emitted (1), with an average emission rate of 2.4mg/h per person. Even though CO2 emissions are more than 16,000 times greater than human respiratory VOC output, these potent chemicals should not be neglected.
As one breathes, increased VOC concentrations in room air decreases the differential pressure that pushes these waste chemical products out of our bodies. High room VOC concentrations cause elevated VOC concentrations in our body, impacting our body chemistry. Figure 2 is a plot of total VOC concentration in a room with varying levels of fresh air flow per person.
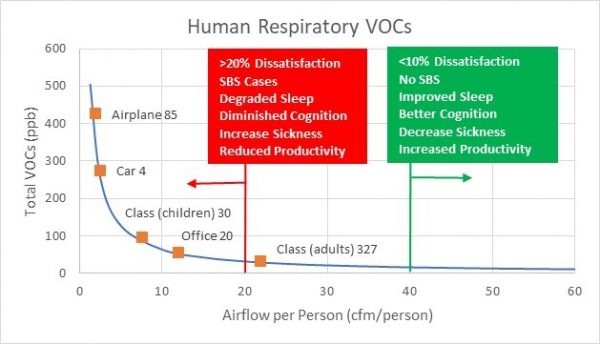
Figure 2 includes field measurement data for total VOCs reported by Fenske and Paulson (1). The agreement between human respiration VOC emissions and VOC field data indicate that human breath is the primary contributor of VOCs in those indoor environments. If non-human VOCs were significant contributors, the VOC field data would be higher than the trendline for human respiration VOCs. This is good news because we have sensors that can detect human VOCs whereas just a few decades ago we had to rely on our noses. Our noses are not very sensitive, and in many cases cannot detect today’s manufactured chemicals infused in our home’s construction materials and furnishings.
VOCs such as formaldehyde and other non-human released VOCs add to human VOCs in indoor environments. When total VOC concentrations are greater than expected from human breath emissions, we need to look for other chemical sources and bring in more fresh air! Figure 2’s broad occupancy range and varying indoor situations indicate that we should expect that human VOCs to be the dominant contaminant in many indoor environments.
Figure 3 below shows how human-correlated particulates vary in a room with filtered fresh air delivered to the room. Almost all particulate data today are “particulate mass” readings, such as the familiar PM2.5 (cumulative particulate mass for 2.5 micron and smaller particulates) and PM10 (cumulative particulate mass for 10 micron and smaller particulates). Today, we have sensors capable of surveying the actual particulate “count” rather than the crude particulate mass readings. Figure 3 assumes particulate emissions of 10 million per hour per indoor occupant. An incredible number, but true!
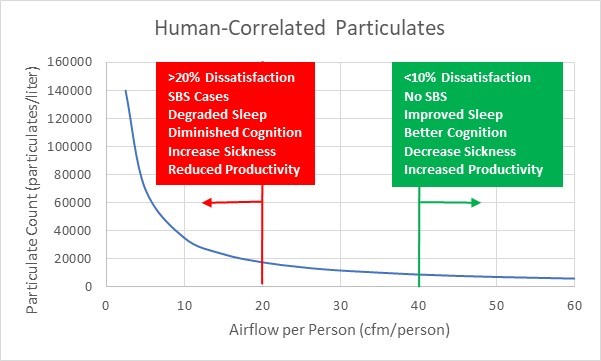
Very little effort is needed to increase particulate count to much higher levels. Cooking, smoking, vaping, wildfire smoke, wind-drive dust, and other non-human sources particulates easily push particulates to more than 1 million particles per liter in the air you’re breathing! A person in a room with a modest particulate count (PC) of 100,000 particles per liter and an 8 liter per minute respiration rate inhales more than 1 billion particulates per day! That’s enough for 3 particulates to reach each of our 330 million alveoli (air sacs in our lungs) per day. Where do those 1000 particulates per year deposited in every alveoli go? Anywhere they want. They are small enough to move across the alveoli cell membrane into our bloodstream where the sky is the limit as far as movement throughout our bodies.
Our own research at Build Equinox (in collaboration with University of Illinois Environmental Engineering faculty and graduate students) have found that particulates are emitted whenever a human is in a room. Sitting quietly releases about 1 million particulates per hour. Various levels of movement and activity (eg, simple movements, shuffling papers, walking, etc) significantly increases human-related particulate emissions. Most of these particulates are less than 1 micron in size and contribute very little to “particulate mass” readings, despite their large numbers. These small and potentially infectious particulates, as described above, can move into every nook and cranny of our bodies.
What Should We do?
We apologize for sounding like a broken record (for those who still remember what a record album is), but maintaining healthy indoor air requires dynamic and active fresh air management inside every human occupied space. When humans are not in the room, no ventilation is needed. When a human enters, automated detection and removal of pollutants relieves our brains from the burden and stress of manual management so we can be doing the things we enjoy. Automated control of IAQ relieves stress and saves time. Just 15 minutes of your day spent reading a sensor and manually adjusting ventilation or opening/closing windows adds up to more than two weeks of work vacation per year!
Figures 1, 2 and 3 show regions of inadequate ventilation and adequate ventilation, based on research investigating air quality dissatisfaction, SBS (Sick Building Syndrome), sick days, cognition, productivity and sleep. Today’s ventilation standards (ASHRAE 62.1 and 62.2) falls largely in the region below the red line. Build Equinox recommends doubling today’s ventilation standards, as represented by fresh air flow rates greater than the green lines in Figures 1, 2, and 3.
The benefits of increased fresh air ventilation are obvious! Air quality dissatisfaction is reduced, SBS can be eliminated, sick days are reduced by 40% (pre-Covid), cognition is potentially increased by 10% (more research needed to verify), and sleep quality is improved (followed by a more productive day)! Wow!!
We didn’t even know SBS existed until the 1970s energy crisis when moved ASHRAE to reduce ventilation standards to 5cfm per person. Today’s nominal 15 to 20cfm per person of fresh air is derived from 1930’s research at Yale, based on 20% air quality (odor) dissatisfaction. When the energy crisis shifted ventilation to much lower ventilation levels, air quality dissatisfaction, SBS, and body odor skyrocketed, resulting in a quick reversal toward previous ventilation rates. Ironically, prior to the 1930’s research, 30 to 40cfm per person of fresh air was common.
Unfortunately, today’s ventilation standards have been stuck in the 1930s even though we have cost effective technologies for sensing and controlling air pollutants. Energy is a concern, so we should (and, Build Equinox has extensively) examined energy implications of doubling today’s ventilation standards. But, we should never sacrifice our health in order to “save” energy. A healthy, productive human is much, much more valuable than energy….and energy is valuable.
Rather than taking our word, researchers at Harvard’s TH Chan School of Public Health have similarly examined the cost of doubling today’s ventilation rates. Their study assumed ventilation was doubled from today’s standard without adding any energy recovery or energy efficiency enhancement equipment. The most challenging climate zones in the US had building utility cost increase of a whopping 2 ½ cents per hour per person ($50/year per person)! Utility cost for many climate zones were insignificant. Increased fresh air ventilation in some climates even reduced utility cost!
Aren’t you worth an extra 2 ½ cents per hour? The payback benefits are equally impressive. Doubling today’s ventilation standard air flow reduces sick days by 40% (1 sick day less) for a cost savings of $500 per year, or 10 times more ($0.25/hour) than increased ventilation utility cost in harsh climates. A potential 10% productivity gain for has a value of $5000 per year person ($2.5 per hour) savings, worth 100 times the potential utility cost increase. If only 1% productivity gain is realized by doubling fresh air, the value is still 10 times potential energy cost. And, you sleep better, too!
Here's the good news. You do not have to wait for ventilation standards committees to realize they need to leave the horse-and-buggy carriage era. We know what is needed to maintain exceptional IAQ, and that fewer sick days, increased productivity and improved sleep pay for enhanced ventilation energy cost.
Build Equinox’s CERV2 is not a ventilator. It is a very smart and powerful indoor air quality management system that automatically keeps your indoor healthy.
Its purpose…. is to CERV (serve) you!
- 1) D. Fenske and S.E. Paulson, “Human Breath Emissions”, J. Air & Waste Manage. Assoc. 49:594-598, ISSN 1047-3289, 1990

