The concept behind Pretty Good House (PGH) is pretty darn simple. Economically optimize a house relative to its climate, construction material cost, mechanical component efficiencies, and energy cost. Implementation of the PGH concept is not so simple as one tries to find design tools that conveniently combine economic, energy and comfort conditioning analyses.
ZEROs (Zero Energy Residential Optimization software) is one of the few design tools that seamlessly combines economic, energy and comfort conditioning modeling for residences. And, ZEROs is free-to-use, online software that has been vetted with US DOE Bestest and validated with field data measurements.
We covered economic and energy performance in previous newsletters for the Taylorville High School Pretty Good House project (THS PGH). In this article, we use ZEROs for the third part of PGH design, “Manual J” modeling of comfort conditioning capacities for different regions of the THS PGH. We define four zones for the THS PGH, and use ZEROs to model each zone’s winter and summer comfort conditioning loads.
Once comfort conditioning loads for each zone are determined, one can select the type of conditioning system for meeting comfort demands, which will be the subject an upcoming article.
THS PGH Construction Update
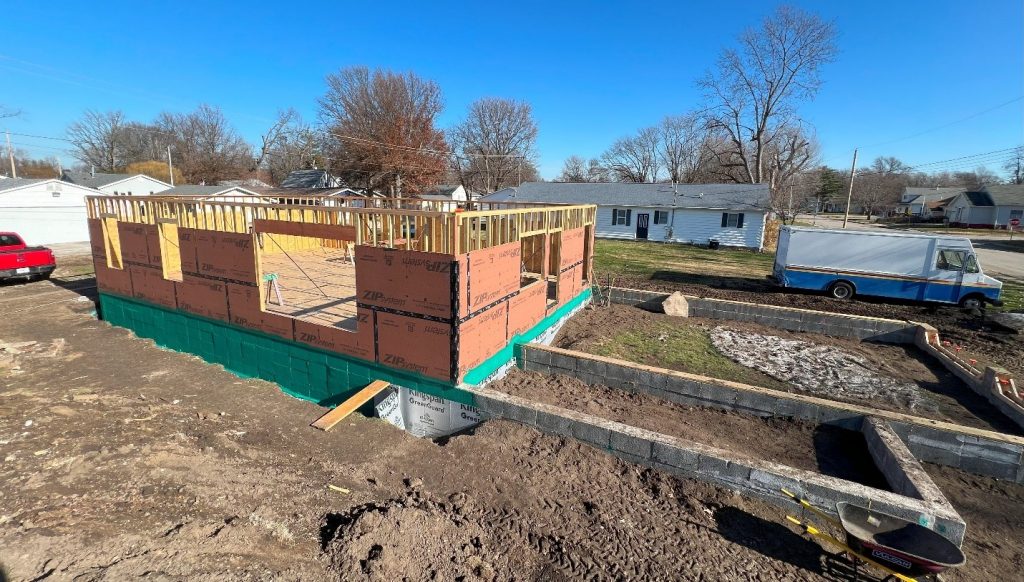
Matt Blomquist’s Taylorville HS students continue working at an aggressive pace. Winter has been nice, providing good weather for outdoor activities. The THS PGH house looked similar on our December 7 visit to our early November visit, however, looks are deceiving! The students finished the crawl space, waterproofed the foundation wall, finished zipping the exterior sheathing, spread gravel in the footer trench, and were in the process of adding exterior fanfold sheathing over the foundation block. During my visit, they continued placing fanfold sheathing around the foundation, filling the trench, and tamping dirt around the foundation. Fill was also being placed and tamped in the garage and porch areas where concrete slabs will be poured.
Filling in the footer trench made room for roof truss delivery in the limited yard space. Organization and planning are important parts of Matt’s student instruction, teaching them think beyond immediate construction activities. Check out Matt’s Build_Learn_Teach Instagram site to see details of their current progress. Now, it looks much different!

THS PGH Manual J Analyses
“Manual J” is the name given to a computational procedure for determining “design day” heating and cooling loads for each region of the house. Originally, Manual J was a sheet of paper with handwritten inputs and computations that characterize heating and cooling capacities for each house zone. Various software and spreadsheet versions of Manual J are available online with a range of costs and ease-of-use.
We use ZEROs for Manual J zone modeling in the same manner as we used ZEROs for modeling the entire house. “Zones” are defined by the modeler. A zone may be a physically distinct region of a home, such as a bedroom or dining room. A zone can be a collection of rooms or integration of spaces such as an open living, dining, kitchen space. Generally, each bedroom region is defined as a zone. Depending on how segregated other rooms are, additional zones are defined.
Figure 3 shows four zones we’ve defined for the THS PGH. Three of the zones are bedrooms (two with bathrooms included), and one zone is for the open living, dining, and kitchen region (including laundry and mechanical rooms).
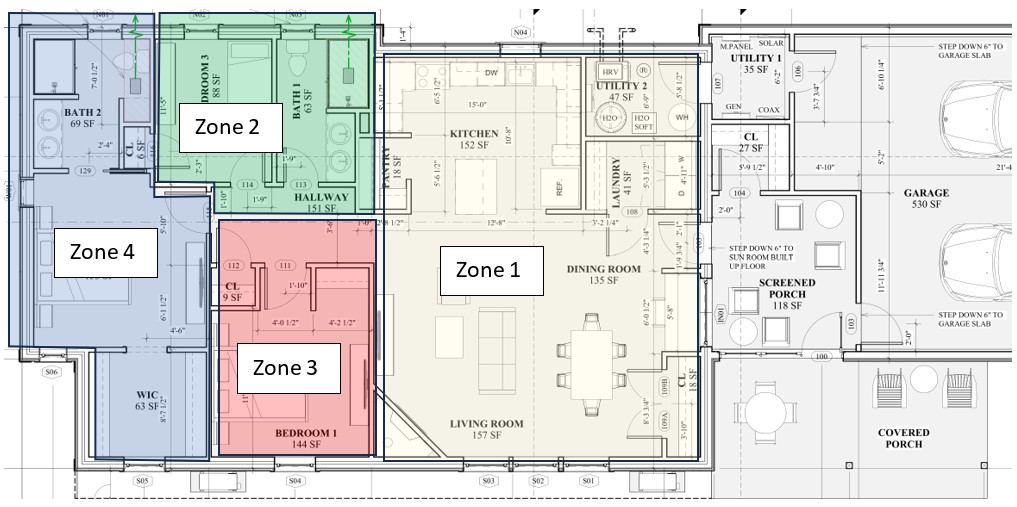
We model the four zones with the following characteristics:
Zone 1: Main living, dining, kitchen, laundry and utility room
Wall area = 480sqft, Ceiling area = 720sqft; South window area = 80sqft; North window area = 10sqft
Plug loads = 200W base + 50W/person
Zone 2: Bedroom 3 and bathroom
Wall area = 130sqft, Ceiling area = 300sqft; North window area = 20sqft
Plug loads = 0W base + 50W/person
Zone 3: Bedroom 1
Wall area = 80sqft, Ceiling area = 300sqft; South window area = 15sqft
Plug loads = 0W base + 50W/person
Zone 4: Master bedroom, walking closet and master bathroom
Wall area = 300sqft, Ceiling area = 400sqft; South window area = 25sqft; North window area = 10sqft; West window area = 15sqft
Plug loads = 0W base + 50W/person
Exterior wall, window, and ceiling areas are defined for each zone and given the same characteristics used for overall house energy analysis. Results are very dependent on input assumptions made by the modeler. Allison Bailes has written a number of excellent articles on Manual J, including this one on “cheating”…..that is, how a modeler can fudge inputs to produce desired results.
Occupancy is very important in high performance home energy usage. With ZEROs, we can conveniently model each zone with differing occupancy levels to understand how comfort conditioning loads change with occupancy. The master bedroom (Zone 4), for example, is modeled with zero and two occupants. The main living area (Zone 1) is modeled with 0, 2 and 4 occupants. Occupancy impacts ventilation requirements, plug loads, and human energy loading (humans are heaters and humidifiers!). The main living area has been given a base plug load of 200W that accounts for refrigerator, appliances, TVs, etc. Each zone is given an occupancy plug load of 50W per occupant, which accounts for lighting, computer, and other electrical uses that scale with occupancy.
Table 1 shows ZEROs predictions for heating and cooling design days. A “design day” is representative of the coldest and warmest days in a year. ZEROs output results show design day temperatures used for each geographical location. Build Equinox has developed its own design day temperature and humidity database that represent a temperature that is not exceeded more than 0.4% (35 hours) of a year, on average. But “average” never happens! No one is average height. Some people are taller than average, and some people are shorter than average, but no one is average. The same is true for weather…an average weather day never happens. In reality, a location may not exceed design day conditions for 5 or 10 years. And then, Nature decides to catch up on things with a year that exceeds extremes for a week or more.
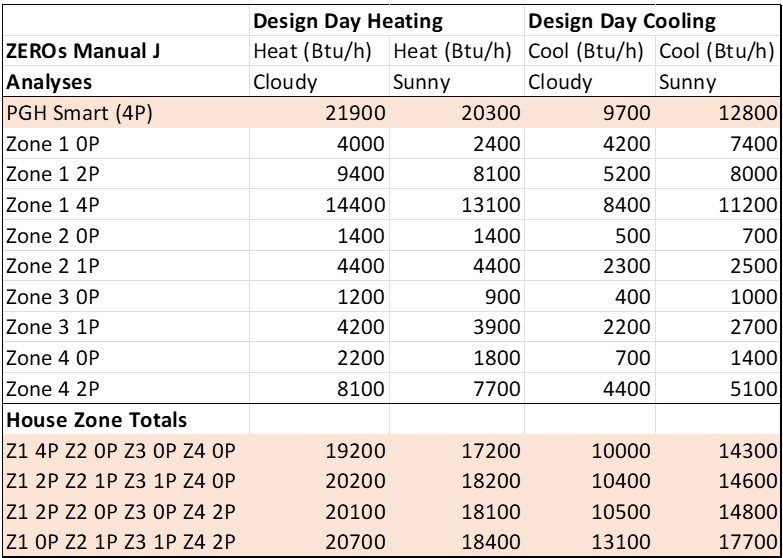
The first part of Table 1 shows ZEROs predictions for the overall house with 4 occupants, and for each zone with differing occupancy level. The lower part of Table 1 combines individual zone loads, keeping overall house occupancy constant at 4 occupants. For example, “Z1 4P Z2 0P Z3 0P Z4 0P” represents everyone in the main living, dining, kitchen area (Zone 1) with no occupants in the bedrooms. At nighttime with all occupants in bedrooms, the main living area has no occupants (Z1 0P Z2 1P Z3 1P Z4 2P).
The sum of the zone loads should be similar to the whole house energy usage results, but not identical. Whole house modeling distributes overheating and overcooling of smaller subzones, leading to differences. Water heating with a heat pump water heater also results in differences. ZEROs whole house results include heat pump water heater effects while the individual zone analyses does not include hot water usage (but could with ZEROs).
Table 1 shows “cloudy” and “sunny” day impacts of solar energy on each zone’s load. Sunny winter days reduce heating capacity needs while sunny summer days increase air conditioning loads. Cloudy winter days and sunny summer days should be used for sizing comfort conditioning equipment. We see reasonable differences between sunny and cloudy days, indicating that the THS PGH house has reasonable window areas. Note how summer sun loading is more significant than sunny winter day reduction of heating capacity. That is, winter benefit of windows is often more than offset by summer cooling loads.
Based on Table 1 results, we need about “2 tons” (24,000Btu/h) of heat pump capacity. We will look more closely at heat pump capacity in the next article as we select equipment for the THS PGH project. Note that Zone 1 (main living area) needs about 1 ton of heating and cooling capacity while the other zones 3 zones require about 1 ton of combined conditioning capacity.
Historically, 1 ton of capacity refers to the thermal energy required to melt one ton of ice over a 24 hour period, and is equivalent to 12,000Btu/h (3.5kW). It is now common to use tonnage for both heating and cooling loads. Manufacturers are usually referring to cooling capacity when they list a heat pump model’s capacity in tons. Heating capacity is generally similar to cooling capacity for a heat pump, but somewhat higher than cooling tonnage because compressor power is beneficially added to heat delivered to a space in addition to “heat” pumped from the cold side to the warm side.
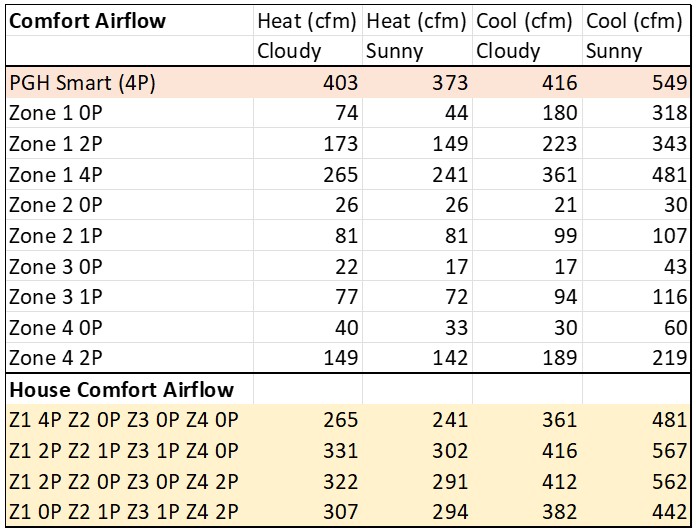
Table 2 shows an estimate of air flow rates needed to deliver heated and cooled air to each zone to meet design day conditions. For homes with radiant or other conditioning systems (eg, fireplaces), comfort conditioning energy does not rely on air flow delivery. For the THS PGH, air-to-air heat pumps will be used for comfort conditioning. We will make use of these air flow values for duct design (“Manual D”) in a future article as we design ducting for distribution of comfort conditioning and fresh air.
Air flow rates in Table 2 are based on delivery temperatures of warm and cool air that are typical for today’s heat pumps. During winter heating, heat pumps deliver 120 to 125F temperature relative to a room temperature of 70F. Today’s inverter drive (speed controlled) compressors modulate their speed to keep air delivery temperature in this temperature range. For summer conditions, heat pumps keep delivery temperatures in the 45 to 50F, adjusting compressor speed (and fan speeds) to maintain relatively constant delivery air temperature as comfort capacity loads change.
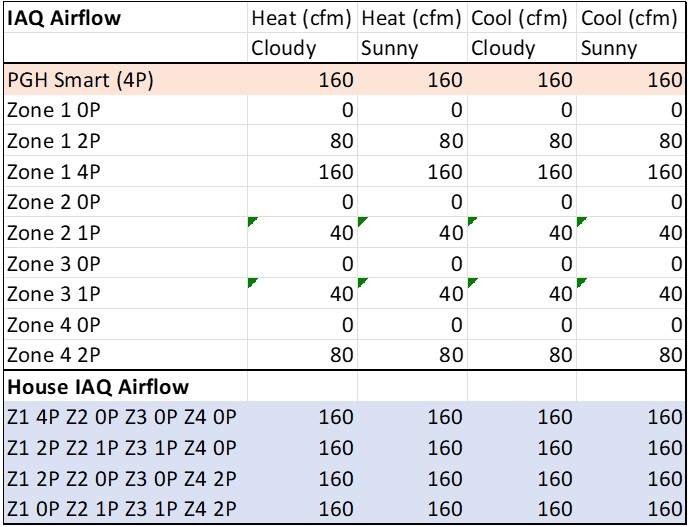
Table 3 shows recommended air flow for each zone based on occupancy to maintain healthy air quality. Build Equinox recommends 40cfm per occupant, resulting in 160cfm air flow for the main zone when fully occupied, and less than that in other zones with less occupancy. These airflows vary with occupant activity, too. A workout room needs elevated air flow to account for higher respiration levels (3 to 4 times sedentary metabolism) while bedrooms require less than we’ve assumed during sleeping periods because sleep metabolism (and respiration CO2) is a about half of sedentary levels.
In today’s efficient homes, we sometimes find that indoor air quality air flows are larger than comfort conditioning air flow requirements. For the TGH PGH home, comfort conditioning dominates air flow and duct sizing.
Summary
Manual J analyses allows us to determine comfort conditioning capacity requirements for different regions of a house. For today’s high performance homes, such as the THS PGH project, human occupancy in zones is important. As discussed in our earlier THS PGH energy article, plug loads and water heating loads are almost 2/3 of annual energy needs with loads impacted by climatic loading (comfort conditioning, ventilation, and infiltration) only 1/3 of annual energy usage.
Design day analysis of comfort conditioning loads is based on winter and summer conditions that are infrequently encountered. One of the benefits of today’s speed controlled heat pumps is that their efficiency increases at reduced loads. That is, oversizing a speed controlled heat pump results in higher system efficiency…not lower…when operating at reduced capacity. A two ton heat pump operating a one ton capacity can realize a 20 to 30% efficiency increase in comparison to a one ton unit operating a full capacity! You do need to know what you are doing to achieve this gain, one of the largest energy efficiency gains available….and that’s why you should follow our upcoming articles!
