Equinox House celebrates the spring equinox by bidding adieu to direct sunshine for the next 6 months as our “equinox overhang” protects us from excessive solar energy input while maintaining wonderful blue sky, non-glaring daylight throughout the summer. A beautiful super moon traversed our clerestory windows this week, bathing Equinox House in a wonderful silver light throughout the night.
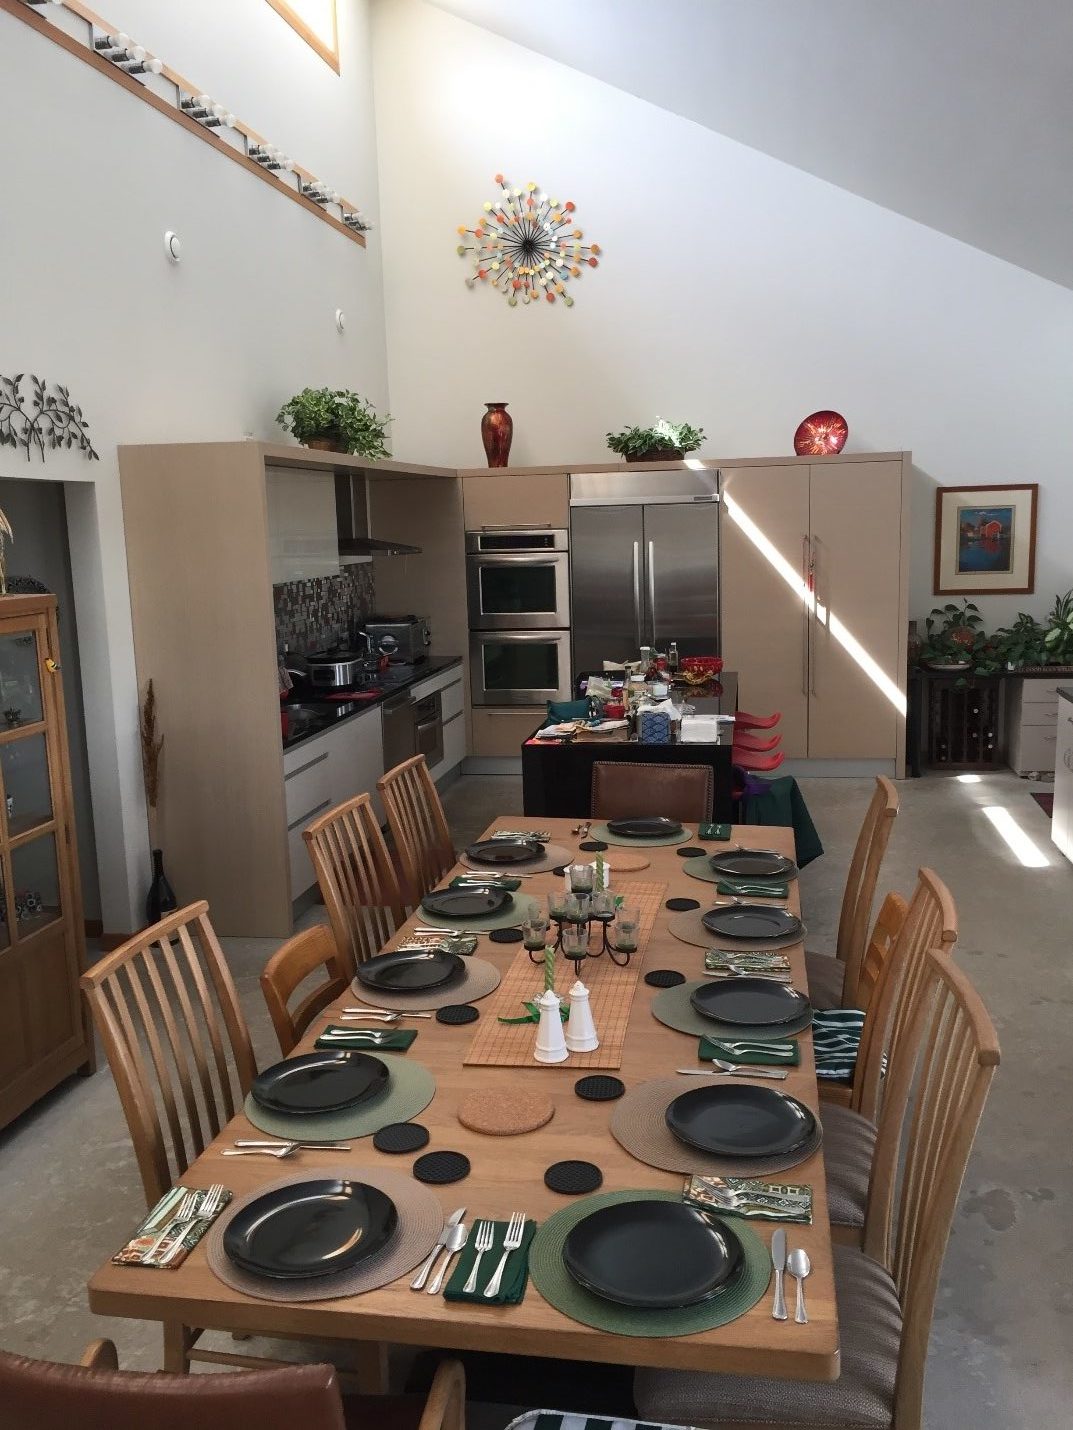
We had eleven for dinner on Tuesday, March 19, 2019 to celebrate St Patrick’s day and an eagerly awaited spring. The picture above shows Equinox House ready for guests along with a view of the final days of direct sunshine. The spring Equinox is an optimal time in our area to exclude direct sunshine from a home’s interior. Internal solar gain rapidly switches from being a beneficial heat gain to an undesirable air conditioning load. Blue sky (diffuse) light is more than sufficient with a 10% window area to floor area ratio to wonderfully light a home’s interior, while cutting excess summer solar heat gain by 85%! Ten square meters (about 90 square feet) of unprotected, solar facing windows with a SHGC (Solar Heat Gain Coefficient) of 0.5 transmits 5000 Watts of heat into a home (1.5 tons of cooling capacity)!
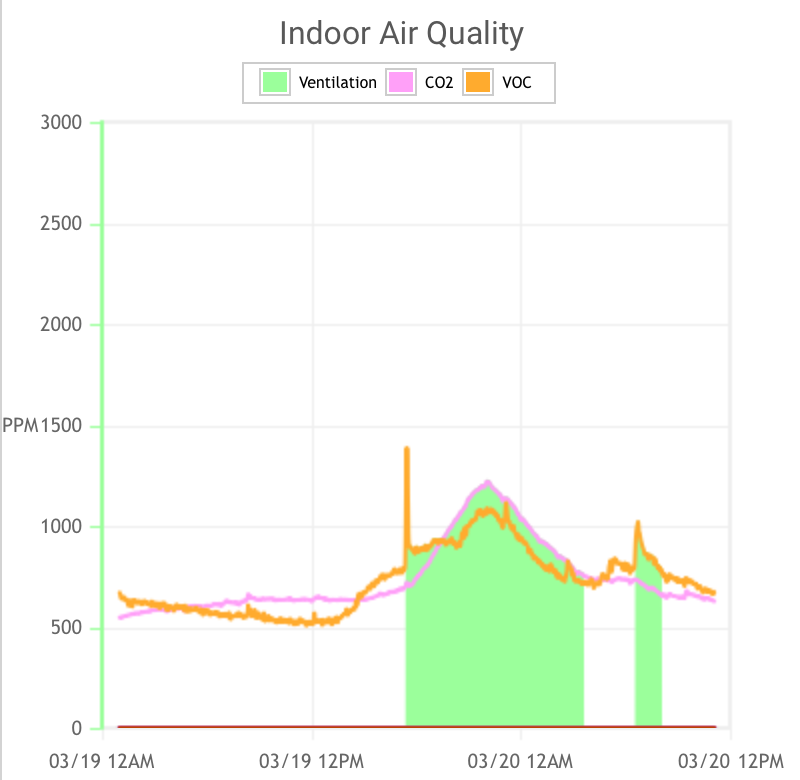 Figure 2: Air quality for eleven dinner guests after a day filled with cooking and cleaning is automatically managed with the CERV smart ventilation system.
During the day on March 19, cooking and cleaning preparations increase pollutant concentrations steadily until the CERV’s user-selected 850ppm threshold automatically triggered fresh air ventilation. Carbon dioxide generally “leads” pollutant levels in Equinox House because of our low VOC generation. In all-electric homes with judicious selection of no-VOC building materials and furnishings, and occupant activities that minimize VOC generation, CO2 will be the dominant pollutant because human metabolism generated VOCs tend to decay through natural reactions into CO2 and water. Cooking odors, as wonderful as they were on March 19, added to human VOCs, increasing VOCs above the human respiration generated CO2. By noontime, the CERV began fresh air ventilation as noted in Figure 2 with the green shading. Guests arrived by 5:30, and stayed until 10pm (we’re old, so that’s a late night for us). The CERV continued in fresh air mode until 6am the next morning when the CO2/VOC threshold dropped to 750ppm. An additional fresh air vent period was initiated later in the day on March 20 for a briefer period of time when pollutant levels again reached 850ppm.
CERVs came online nearly 5 years ago with our CERV-ICE (CERV-Intelligently Controlled Environment) platform. CERV-ICE provides CERV Community members free access to their archived data. CERV user data is not shared or sold to others. We introduced CERV Analytics two years ago to the CERV-ICE platform in order to better explain the meaning of our exposure to indoor pollutants.
 Figure 3: Average VOC and CO2 levels are always low in Equinox House due to judicious choice of building materials and furnishings, occupant habits, and smart ventilation.
Figures 3 and 4 provide additional information on Equinox House’s air quality profile. In Figure 3, average weekly VOC and CO2 concentrations (in “ppm”, “parts per million”) are shown in relation to the “CERV Community” (all online CERV owners). Many CERV owners prefer an IAQ setpoint of 1000 to 1100ppm rather than the 850ppm we’ve selected for Equinox House. Figure 3 indicates that CERV Community CO2 average is 1000ppm, while CERV Community average VOC concentrations have been in the 600-700ppm range. Note that the CERV’s total VOC concentration units are based on a scale that is correlated to a human’s CO2 and VOC output rather than a true VOC concentration scale. We prefer this scale because it tells us whether a home’s VOC levels tend to be human dominated VOCs versus those VOCs added from other sources such as from furnishing and furniture offgassing, cleansers and chemicals, and other non-human sources. Figure 3 shows that Equinox House has a total VOC/CO2 ratio of 1.2. As VOC/CO2 ratio increases above 1.5, home occupants should investigate other potential sources of VOCs. It is important to realize that we humans are biochemical reactors, and we generate a broad range of chemicals as well as a wide range of output (not necessarily odorous; odor and chemical concentration are different characteristics). And, it is important to realize that not all VOCs are bad. Grandmother’s chicken noodle soup odors are healthy, medications delivered by nebulizer are essential, and the fragrance of a spring flower often produces a feeling of well-being.
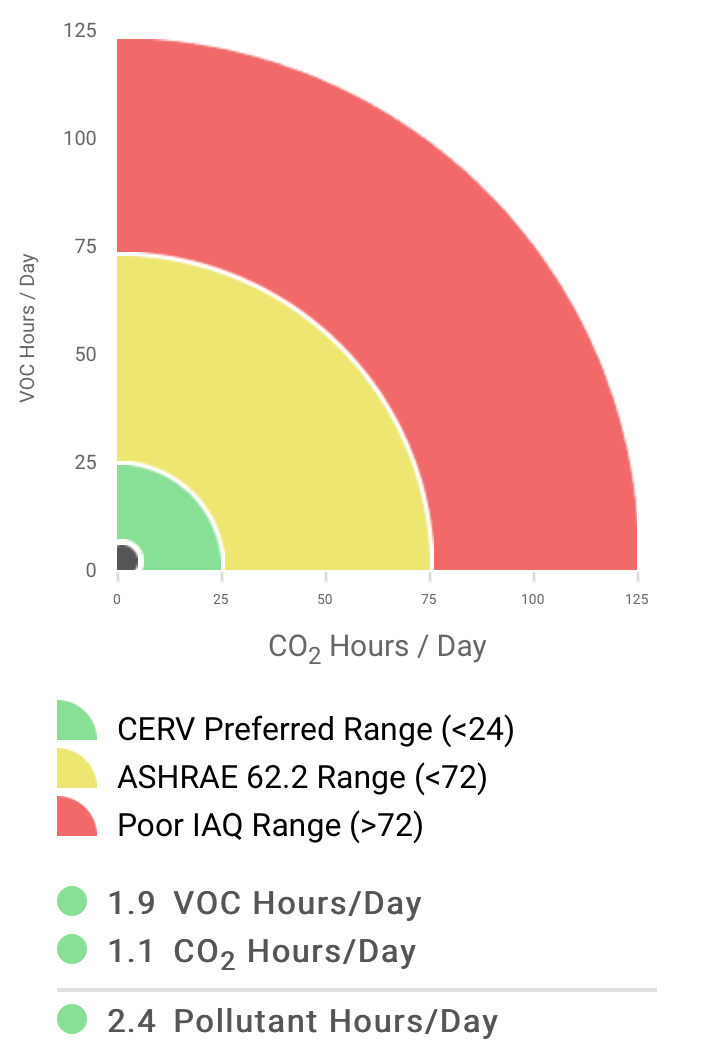
Figure 4 shows Equinox House “pollutant-hours per day” exposure of VOCs and CO2. Similar to kilowatt-hours, a pollutant-hour is the integrate exposure to a pollutant concentration over a period of time. We define immersion of a human for 1 hour in 1000ppm of CO2 as one CO2 pollutant-hour. Similarly, we define immersion of a human for 1 hour in 1000ppm equivalent of total VOC for 1 hour as one VOC pollutant-hour. CO2 pollutant-hours and VOC pollutant-hours are vector combined (square root sum-of-the-squares) to form “total pollutant-hours”. The IAQ community is at an early stage of defining pollutant exposure, and as sensing technologies evolve (eg, VOC sensors that distinguish between chicken noodle soup aromas and formaldehyde), additional weighting or emphasis can be placed on different pollutants. Build Equinox’s pollutant exposure formulation anticipates and allows for this evolution to occur, as well as incorporation of other health and well being impacting factors such as particulates. Stay tuned!
Note that Figure 4 shows Equinox House to be 2 to 3 pollutant-hours per day. The green region (less than 25 pollutant-hours per day) is where we would like to see all homes. The yellow region in Figure 4 is the exposure range for homes ventilated with ASHRAE 62.2-2016 with occupancy based on 1 plus the number of bedrooms. The red region should be avoided, but unfortunately, we see too many homes (both leaky and sealed) with air quality in this range. Air quality is poor in leaky homes because where one lives and where the leaks occur are often different.
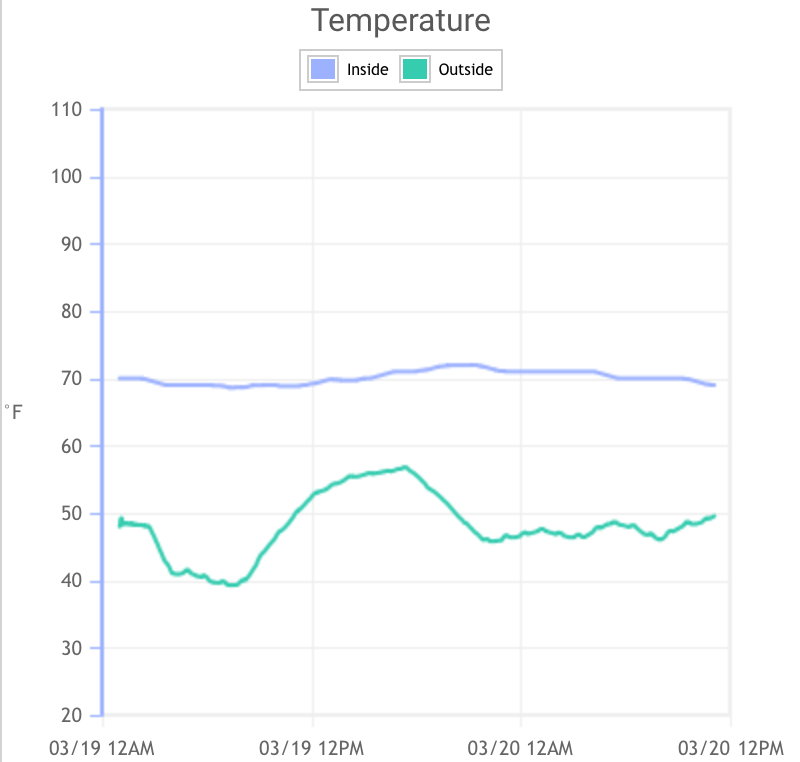
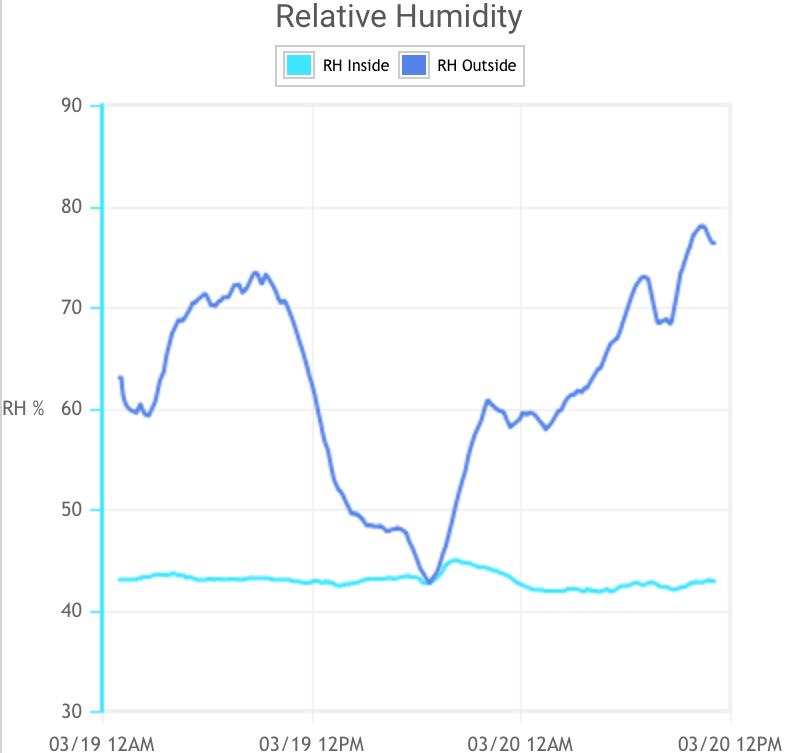
Figures 5 and 6: Good design and construction practices resulted in an economically optimized, zero-plus home with steady, comfortable indoor temperature and humidity.
Figures 5 and 6 display the comfort conditions in Equinox House on March 19 and 20. Proper design of home and comfort conditioning systems, coupled with the energy efficiency of smart ventilation and smart air distribution, result in high energy performance and a healthy indoor environment.
Visit our website to view these results and more than 4 years of online CERV data from Equinox House. Equinox House’s CERV unit is nearly 9 years old! Scroll down the home page to the “Take Control” section and click on the screen. Live Equinox House conditions will appear. Click on the control screen to make changes to current settings (we don’t enact your changes, but you’ll get a feel for how easy it is to control a CERV). Also, view “historical” and “analytics” information and observe the continual comfort and excellent IAQ in Equinox House, whether we’re in the middle of a polar vortex with -15F or experiencing our summer’s heat and humidity from Louisiana.
Interested in learning more about our IAQ Metrics? Check out our April 24th free Webinar, Indoor Air Quality Metrics: Avoid Living in a Home that Makes you Stupid, Sick, and Tired.
