Key Points:
COVID-19, a new and deadly virus, is spreading throughout the world with alarming effectiveness. Although the spread of COVID-19 appears similar to seasonal influenza, we do not have immunity to protect us and retard its propagation and many infected individuals do not show symptoms (such as fever or coughing), making detection of disease propagation very difficult. COVID-19 is more deadly than seasonal influenza, with a reported mortality rate estimated to be 2 to 3% of infected individuals, or approximately 20 times the mortality of the flu.
What can you do at home? Open it up! Don’t seal yourself off in isolation in your home. A lack of fresh air increases the probability of disease transmission from one family member to another. If you have a fresh air ventilation system, increase the air flow. If you do not have a fresh air ventilation system, do as my Grandma did every night of her life, open windows! The choice is simple: save energy or save lives. The good news is that proper building design with today’s technologies can allow you to do both!
Are you the head of a corporation, a school principal, an airline pilot, or other person responsible for the safety and health of those around you? If so, increase fresh air ventilation now to your business, school, aircraft, and other places where people congregate. And if you’re not in authority, share this article with those responsible for your health and safety.
Fresh air is a first line of defense against airborne disease transmission. Increasing fresh air ventilation decreases the probability of becoming infected and reduces the ability of a disease to propagate. Improved ventilation is essential to reducing airborne diseases as expressed by Professor Joseph Allen of Harvard University in his recent New York Times opinion article.
Read on and learn sensible, effective manners to fight the transmission of airborne contagions. We are in this together, and it is together that we defeat it.
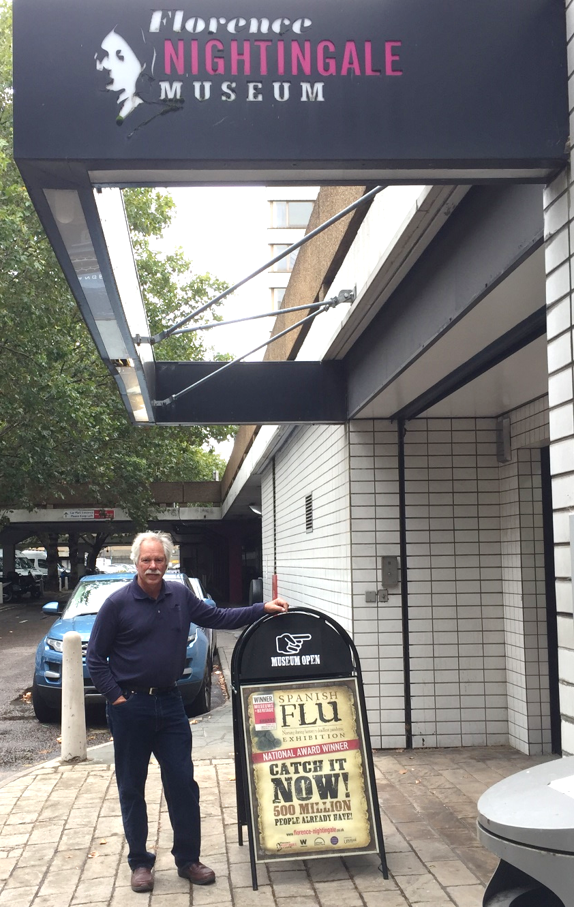 The Florence Nightingale Museum in London featured a special exhibit on the Spanish Flu in October 2019. Florence understood the importance of fresh air 160 years ago.
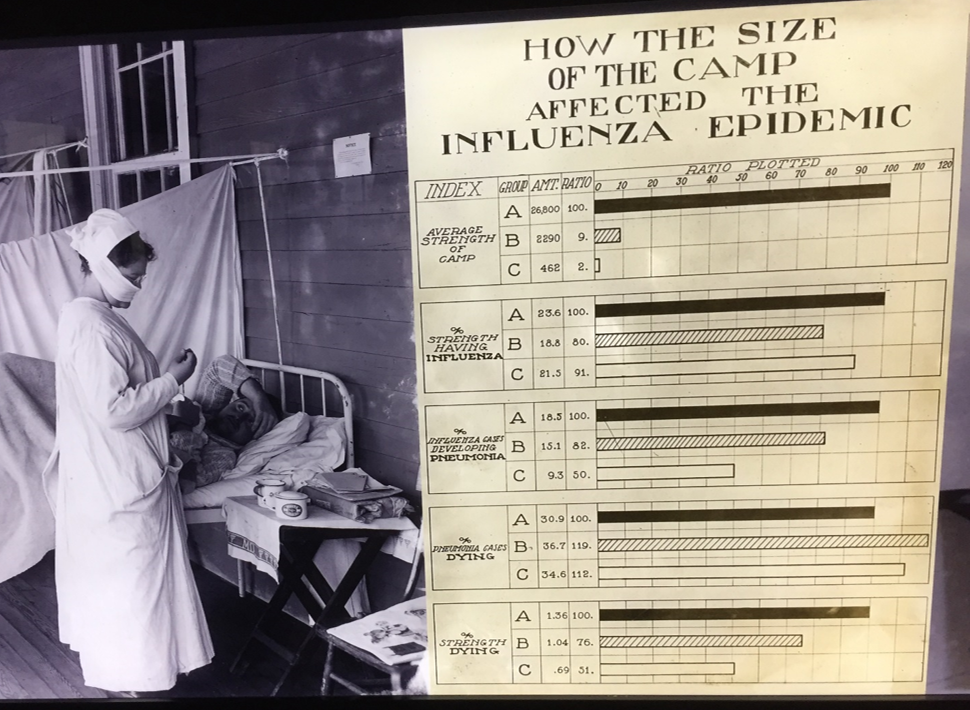 Florence Nightingale developed statistical methods and a scientific approach for combating disease transmission, essential for fighting the Spanish Flu (which did not originate in Spain) in 1918, and important for today’s diseases.
 Fresh, healthy air, as depicted in this photo from the Florence Nightingale Museum, is essential for recovery from any illness and injury while reducing the probability of caretakers becoming infected. Patients are shown recovering outside a London hospital in fresh air along the Thames River.
Sensible Methods for Minimizing Airborne Disease Transmission in Our Homes, Schools, Businesses, and Transportation Systems
We spend over 90% of our time indoors, with nearly 2/3s of our time in our homes. Ventilation systems in our homes and public spaces are often inadequate, and in many cases, are exactly opposite of how they should be designed to minimize the spread of disease and to improve our health, well-being and productivity. Today’s typical ventilation levels of 20cfm (Cubic Feet of air per Minute) per person needs to be doubled to 40cfm per person. In addition, depending on the building type, we need to design ventilation systems differently than those we have haphazardly inherited from years of neglecting the importance of fresh air ventilation.
In order to stop the progression of an airborne disease, such as COVID-19, we need to:
If our buildings have air “as pure as the external air”, using Florence Nightingale’s words, our probability of acquiring an airborne disease is zero, and the ability for the disease to spread is zero! Someone might sneeze on you, or you may touch a fomite (a surface or object with germs on it), but these transmission paths can be significantly reduced with sanitation and caution.
We use the models and parameters from Rudnick and Milton for our predictions (the appendix of this article includes additional details). Actual parameters for COVID-19 are being determined as its spread continues, however, current information indicates these are reasonable assumptions. The trends discussed and preventions suggested are important regardless refinements to these parameters.
Home
We should go home when we are sick, as most everyone knows. At home, the steps we can take to minimize infecting other family members are:
Fresh air ventilation should be increased by any means available. How much? Florence’s words guide us again...as much as you can without chilling the patient. Isolating an ill family member and minimizing their contact time with other family members is important. Use today’s technologies (cell phone, baby monitor, etc) to communicate and tend to their needs. Yes, babies need hugs (as we all do), and that feeling of comfort is important for healing and recovery, so use your judgement.
We consider two home situations:
Our first situation is a common one in which two occupants (one infected and one susceptible) must share a space, such as a studio apartment, a bedroom or a dorm room. Figure 1 above shows the probability of the susceptible person becoming infected. Sharing the space for an hour with 600ppm of carbon dioxide concentration reduces the chance of illness to 25%. A likely situation for couples, siblings or roommates sharing a bedroom would be 8 hours of sleeping in the same room. At 600ppm with 8 hours of shared space, we have an 80% chance of becoming infected. As low of a carbon dioxide concentration as possible helps, but overall, trying to find another space away from the ill person, and minimizing the time required to meet their needs is best.
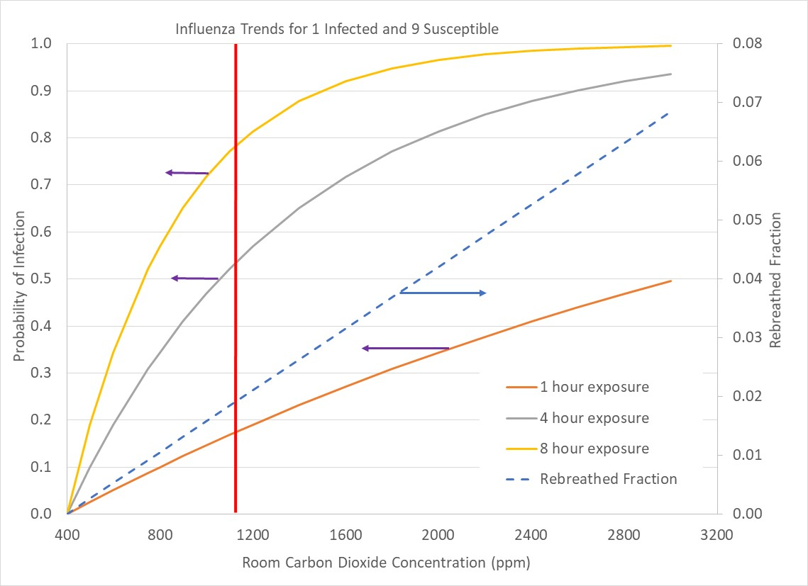
The second scenario is a home with 10 occupants, with 1 infected and the others susceptible. Carbon dioxide in the room primarily comes from uninfected individuals, resulting in a lower probability of becoming infected at a given carbon dioxide concentration. At standard ventilation levels (1100ppm carbon dioxide), we have a 50 to 80% chance of becoming infected with 4 to 8 hours of exposure. Reduction of carbon dioxide to 600ppm reduces our chance to become infected to 20 to 40% for 4 to 8 hours of exposure, a substantial improvement.
The second scenario differs from the first scenario because we have the possibility of more than one person becoming infected by the ill person. The ratio of the number of people in the space who could be infected by a single person is the “building Reproduction Number”, Rao. The Appendix provides more background information for the building Reproduction Number, Rao, and the related “basic Reproduction Number”, Ro. When Rao is reduced to 1 or less, the contagion will die out and cease propagating into the populace.
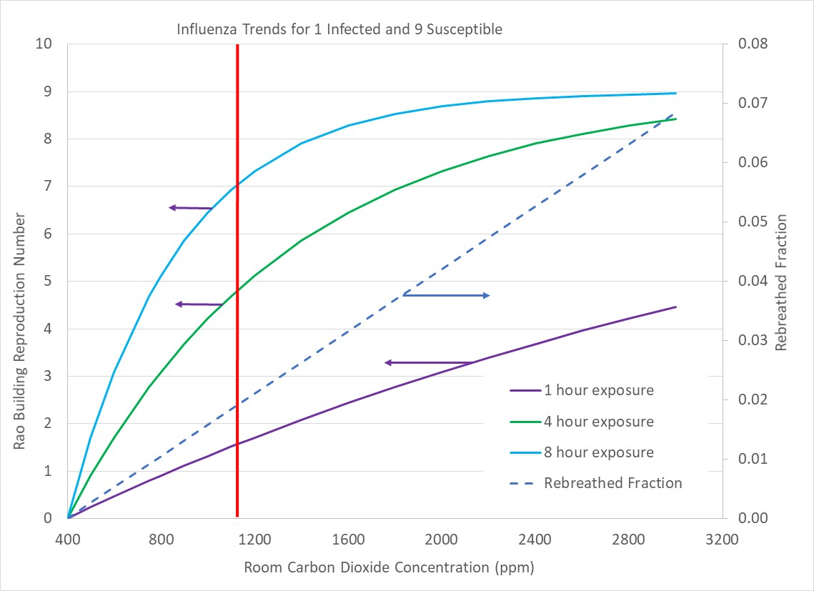
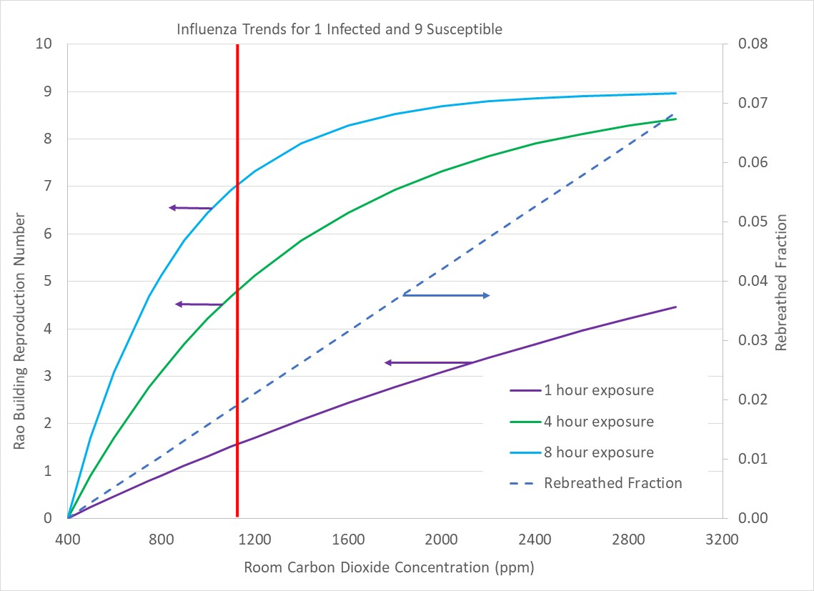
Figure 3 above shows trends in Rao for the case of 10 people in a space with one of them infected. At standard ventilation levels (1100ppm carbon dioxide), 5 to 7 of the room’s uninfected occupants are likely to become sick (Rao = 5 to 7) with 4 to 8 hours of co-habitation. Reducing house carbon dioxide to 600ppm or less reduces Rao to 2 to 4, which is very significant. Rao values of 5 and higher indicate that a disease is likely to propagate throughout an entire population while Rao of 2 or less indicates that less than 60% of a population is likely to become infected.
How long does a room take to reach a carbon dioxide concentration level if it is initially filled with fresh air? That is, if a room has been unoccupied, does it take minutes, hours or days to reach the levels of carbon dioxide and contagion concentrations discussed? The answer is minutes. An unventilated, 10ft x 10ft bedroom (8ft high ceilings) initially filled with fresh air (400ppm carbon dioxide) requires 43 minutes to reach 1100ppm of carbon dioxide concentration when occupied by one, sedentary (office work activity level) person.
Figure 4 shows carbon dioxide concentrations in an unventilated home without recirculation. The home has radiant heating during the winter, so no air circulates throughout the house. Two young girls (ages 6 and 3) share a bedroom. From the first figure (1 sick/1 susceptible), with an average nightly carbon dioxide concentration of 1600ppm and 8 hours shared occupancy, it is clear than when one of the girls has the flu, the other will, too. Even though the home was constructed in the 1950s, and has not had any energy retrofit projects, unhealthy indoor air quality occurs in non-leaky regions such as bedrooms. It is a myth that leaky homes have healthy air!
Public Spaces and Transportation Systems
Indoor air quality in public spaces needs to be monitored and controlled, but unfortunately is mostly left to happenstance. The figures below show probability trends of getting ill in spaces with 10 occupants (1 infected), 30 occupants (1 infected), and 100 occupants (1 infected). This range of occupancy covers situations such as a small business, a classroom, and airline transport. We are interested in how our chances of being infected varies along with how many susceptible people might be infected by a single individual.
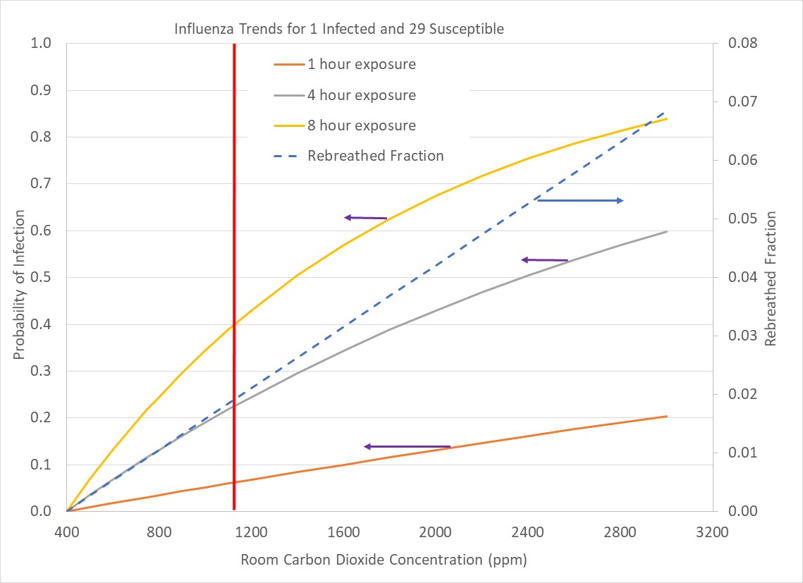
Figures 5-7 show continuing reduction of our probability of becoming infected by a single individual as the number of uninfected people grows relative to an infected individual. That’s great news, but it is only one part of the story. As we move from a small business (10 people, 1 infected; Figure 5) to a classroom (30 people, 1 infected; Figure 6) to a large venue such as a theater, aircraft, or political rally with a 100 to 1 ratio of susceptible people to an infected individual, although our chance of becoming sick decreases, the ability of the sick person to infect a number of susceptible persons increases.
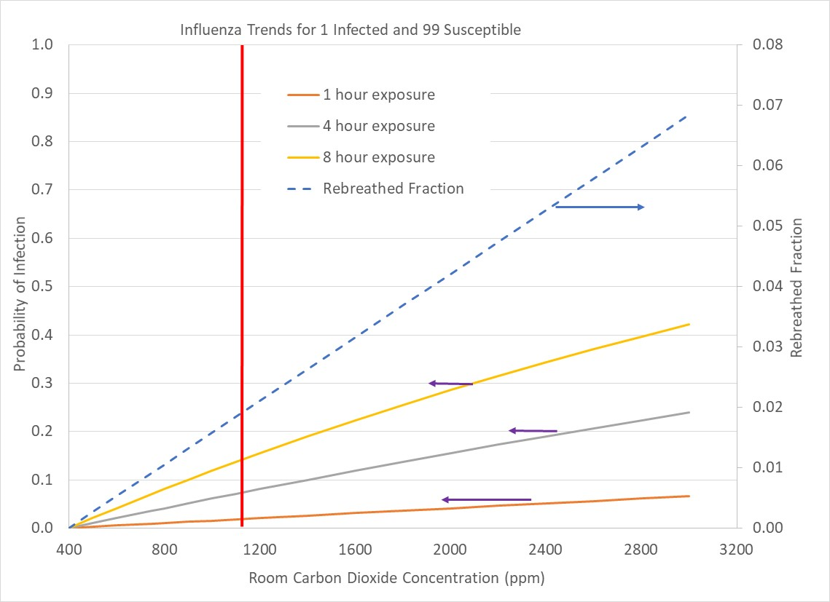
At standard ventilation conditions (1100ppm carbon dioxide) with 8 hours of exposure, our chances of catching the flu decreases from 80% to 40% to 15% as the occupancy grows from 10 to 30 to 100 people with a single infected individual in our midst. Minimizing our exposure time can drop infection probability below 10% for 1 to 4 hours of exposure in a crowd of 100 people. Note that trends in the figures are proportional, such that a space with 100 people of which 10 are infected is the same case as a room with 10 people and 1 person infected.
Increased building Reproduction Number, Rao, offsets the benefit of an individual’s lowered chance of becoming infected in larger crowds. Crowded events increase the number of people infected. And, the more people that can be infected by a single individual, the more a disease will propagate through a population. The trends shown by our estimates are very clear; avoid crowds!
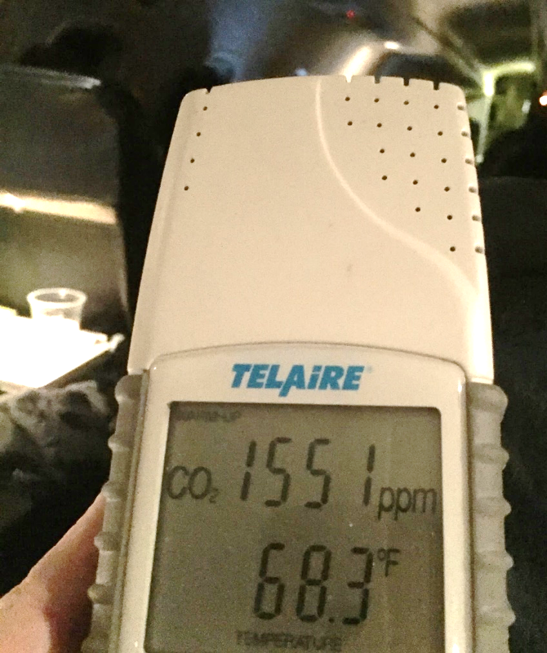 Figure 11: Carbon dioxide concentration on a flight from Philadelphia to Burlington Vermont on a regional jet (“RJ”). Pilots should have carbon dioxide monitors and keep concentrations below 700 to 800ppm. At 1600ppm, one infected passenger is likely to infect 7 others. Yes, I did catch the flu on this trip.
Suggestions for Improving the Design of Fresh Air Ventilation Systems
One ventilation system configuration does not fit all occupied spaces. Occupant density is a factor that helps define how fresh air ventilation systems should be designed. Less dense buildings, such as our homes (~1000ft2 per person) often have unoccupied space with under-utilized fresh air that could benefit the occupied regions. In denser packed buildings, such as schools and businesses (~100ft2 per person), building space is more fully occupied with occupants distributed throughout. At even higher densities (~10ft2 per person) as in a classroom, theater, aircraft, bus or similar situations, air quality management is crucial, requiring ventilation systems with rapid response capabilities that can adjust to high and low occupancy periods.
In the past, energy usage for heating and cooling dominated a building’s HVAC design efforts. Today’s energy efficient homes and buildings are no longer dominated by comfort conditioning (if properly designed). And, today’s heat pump technologies (eg, minisplit heat pumps and “vrf”, variable refrigerant flow heat pumps) allow designers to place heating, cooling and dehumidification capacity in each space directly, separating ventilation air flow from comfort conditioning.
Building designers need to move fresh air ventilation to the forefront of their design considerations rather than leaving ventilation as an afterthought. As expressed by Florence Nightingale many years ago, if building designers and owners were responsible for the health bills of their buildings’ occupants, we would have very different buildings!
Home Environments (~1000ft2 per Occupant)
Residential fresh air ventilation systems in the United States are essentially non-existent, and air recirculation, an important aspect for maintaining home occupant health is sporadic at best. As homes become larger and more complex, zone control with precision ventilation is beneficial.
Today, “one-and-done” ventilation systems are being popularized by some “high performance” home designers. In a one-and-done ventilation system, air recirculation is discouraged. One-and-done ventilation is problematic for three reasons. First, each room receives a fraction of the ventilation air, which reduces the effective fresh air ventilation rate per person in occupied rooms. Second, fresh air delivered to unoccupied regions of the house is wasted. Third, without recirculation, particulates and germs are not effectively filtered and removed from indoor air.
 Figure 12:Schematic of 2000ft2 home with 3 bedrooms and 4 occupants. ASHRAE 62.2-2019 ventilation standards require 90cfm of fresh air. A “one-and-done” ventilation system might supply 15cfm per space in the home, which is not enough for one person in any one space in the house. When everyone (4 occupants) gather in 1 room, pollutant levels soar and people get sick. Recirculation is an effective means to use “stored” fresh air in unoccupied regions of a home as well as providing the opportunity to filter particulates and contagions.
Figure 12 shows a home divided into 6 rooms (eg, 3 bedrooms, kitchen, living and dining rooms). For a 2000ft2 home, according to ASHRAE 62.2-2019 ventilation standard, the house requires 90cfm of fresh air. Evenly dividing the air within the house delivers 15cfm per room, which is insufficient for a single occupant in any room. When all household occupants are in one room as depicted in the graphic, pollutants soar. Each occupant in the room receives less than 4cfm per person, while unoccupied rooms are receiving excessive ventilation that flows to the house exhaust without ever benefiting house occupants. In effect, more than 80% of the fresh air flow is wasted, and house occupant health and cognition are impacted.
Smart ventilation and smart air distribution technologies automatically maintain exceptional air quality in an energy efficient manner. Read our Smart Ventilation and Smart Air Distribution reports to learn more.
Public Environments (~100ft2 per Occupant)
 Figure 13: Schematic of an office building with 6 offices with 1 person per office. Common ventilation design in public buildings recirculates air throughout with an injection fresh air and an exhaust of return air to and from the recirculated air. Why should one infected person’s germs be transmitted throughout the building? Each office, classroom, conference room, and space in buildings with people distributed throughout should have local fresh air supply and exhaust.
Businesses, schools, and other public buildings are exactly the opposite from today’s house ventilation environment. Air is recirculated throughout a building, as depicted in Figure 10 above, allowing the efficient dispersal of contagions to all regions of a building. What sense does it make to share the air from an infected person’s office with everyone else in the building? Each office, classroom, conference room and other spaces should have individual fresh air ventilation systems! Centralized duct ventilation systems should be eliminated. Punch two holes in the exterior wall of each space for localized fresh air supply and exhaust, and add a smart energy recovery unit. And save money, too, because localized ventilation is less expensive to build and operate than centralized ventilation.
Build Equinox is primarily focused on the residential indoor environment; however, our health and well-being is dependent on all of the indoor environments. We have studied indoor air quality in schools, churches, libraries, motor vehicle license facilities, banks, commercial aircraft, airports, and office buildings, and the results are often not good. Read our report describing a 25,000ft2 office building with 130 employees. The building’s indoor environment regularly has carbon dioxide levels well above 1000ppm. As discussed in the report, potential employee productivity savings due to better air quality is much more valuable than the building’s annual utility cost. Ironically, increased fresh air ventilation with smart building controls would also decrease the building’s utility cost without adding any energy savings equipment modifications!
Do you know that most buildings have more than 20% dissatisfaction among building occupants? If you would like to make people happier in your building (and we hope you do), give occupants control over their air quality and comfort! Individual space comfort and air quality control is practical, cost effective, and energy efficient! Read our report “The Best Building on Campus” to learn about a demonstration office we constructed at the University of Illinois to prove the point. I wrote this report as a member of a building committee for the Department of Mechanical Science and Engineering. Our old building was to be renovated and a new building addition constructed. Unfortunately, I failed to persuade others to avoid repeating past mistakes. The renovation and new building construction are currently underway with typical building materials and HVAC system. Maybe we’ll be wiser for the next project?
High Density Public (~10ft2 per Occupant)
High density occupancy situations, such as in aircraft, theaters, and special events are very dynamic, and should have air quality control capabilities that can quickly adjust to a given situation.
One of the places where you are likely to receive an infectious dose of germs is in the boarding bridge at an airport. Figure 14 below shows air quality in the boarding bridge of an airport. Boarding bridges, the rectangular tubes that extend from the airport to the aircraft, are often stagnant, forgotten spaces that are regularly packed with people. Sometimes, air ducts from the aircraft’s “PCA” (Pre-Conditioned Air) unit are connected to the boarding bridge, however, that is an optional feature, and even when included in a PCA, it is often not activated.
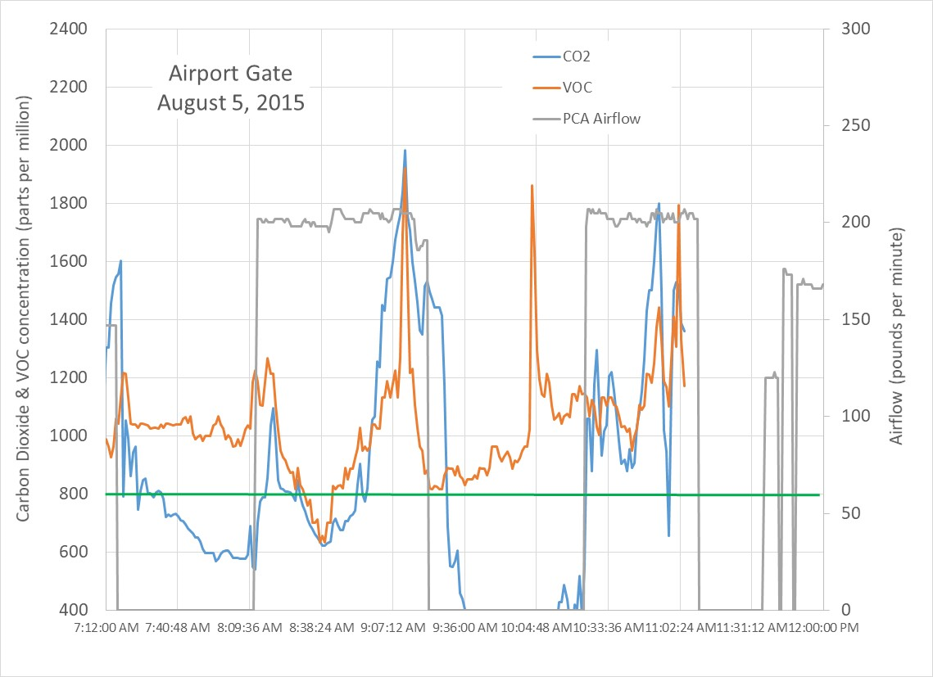 Figure 14: Aircraft boarding bridge air quality for two aircraft during unboarding and boarding events.
When an aircraft arrives, the plane is unloaded, then loaded. The gray line shows PCA unit air flow, which is connected to the aircraft. Air blown into the aircraft leaks to the outside at the connection between the boarding bridge and the aircraft. The door to the airport is closed for security reasons, effectively stagnating the boarding bridge. Passengers debark more efficiently than they load, as seen by the higher pollutant levels during loading when passengers are standing still in the boarding bridge, breathing, sneezing and wheezing over each other. If pilots do a poor job controlling aircraft cabin air quality, disease is efficiently incubated and propagated to the next destination.
Summary
An immediate action we can undertake to decrease the probability of becoming infected with COVID-19, and to reduce its propagation is to increase fresh air ventilation in our homes and buildings. Maintaining indoor carbon dioxide concentrations below 800ppm are desirable. If you do not have a carbon dioxide sensor, consider purchasing one (typical cost $100 to $400; be sure the sensor measures carbon dioxide rather than a VOC or similar gas sensor that is correlated to carbon dioxide concentration). Monitor your home to determine what window openings, ventilation fan settings or other means of moving fresh air into your home will maintain low carbon dioxide levels.
In public buildings, such as schools, work, and churches, ask if they are controlling air quality (most buildings with “demand controlled ventilation” use carbon dioxide sensors). If not, ask why not. Take your carbon dioxide sensor with you and investigate carbon dioxide levels in public places you visit. Any place with higher than desirable levels of carbon dioxide should be avoided, and brought to the attention of building facilities personnel. Unless we let people know this is a priority, indoor air quality will continue to receive little or no attention.
Progress is being made to transform homes and buildings into safe, healthy havens rather than incubators and degraders of our health, but the progress is slow and needs to be accelerated. Smart residential ventilation systems automatically maintain excellent air quality in our homes. DCV (Demand Control Ventilation) systems in public buildings are becoming common in new buildings. We need to connect building facility personnel with human relations personnel such that a potential utility cost savings activity does not occur at the expense of human health and productivity.
High occupant density situations such as commercial aircraft and their boarding bridges need improvement. Why should we get sick every time we fly somewhere? Commercial aircraft, buses, trains, and other transportation systems efficiently incubate and disperse diseases. We need to review all indoor environments to determine how to transform each into healthy spaces.
The modern world is a small place that allows us to connect more rapidly than ever before. We are in this together. My health depends on you, and your health depends on me.
References
D.K. Milton, P.M. Glencross, and M.D. Walters; “Risk of Sick Leave with Outdoor Air Supply Rates, Humidification, and Occupants Complaints”; Indoor Air; Vol 10, pp212-221; 2000
S.N. Rudnick and D.K. Milton, “Risk of indoor airborne infection transmission estimated from carbon dioxide concentration”, Indoor Air; Vol 13; pp237-245, 2003
Appendix - Disease Transmission Characteristics and the Built Environment
We discuss basic disease transmission concepts and the built environment in order to understand how our modern world can hinder or help the spread of diseases around the world. Our focus is on airborne diseases, however, many of these concepts are relevant to other diseases that have other primary manners of transmission.
Reproduction Number, Ro
The Reproduction Number, Ro (“R” naught) is an important concept that defines the spread of disease. Ro is simple conceptually, but complex to define quantitatively. Place an infected person in the midst of many other people who are susceptible (ie, not immune), and the number of people infected by the ill person is Ro. If the contagious person transmits the illness to 3 other people, Ro is 3.
A more formal definition of Ro is:
Ro ~ function of (infection/contact) x (contact/time) x (time/infection)
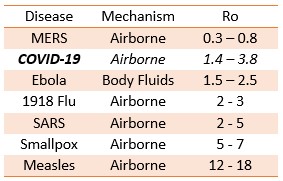
Reproduction Numbers for several diseases are listed in the table below. Note that the above expression has multiple parameters that can alter Ro. Increased fresh air ventilation, vaccination, quarantines, and improved health practices (sneezing into sleeves, washing hands, sanitizing surfaces) are some of the ways that Ro can be reduced. James Holland Jones’s classnotes on Ro are very informative.
A disease ceases propagation and dies out when Ro is less than 1. One must remain vigilant, because conditions can change that favor infection, increasing Ro above 1, causing reignition of disease transmission. Figure 1 shows the estimated fraction of a populace that can be infected when Ro is greater than 1. The fraction of a populace that can be infected rapidly increases as Ro increases from 1 to 5. Harvard Professor Marc Lipsitch estimates 40 to 70% of the world’s populace could be infected by COVID-19, in agreement with Figure 1 assuming the virus to have an Ro of 2 to 3.
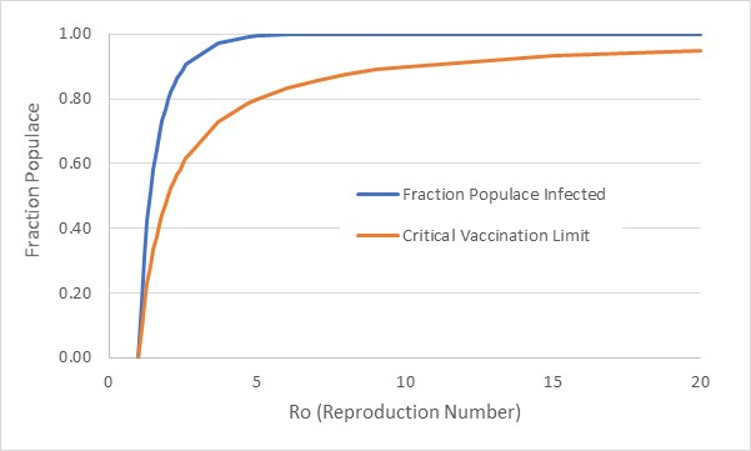 Figure A1: Fraction of populace infected and critical vaccination level versus basic Reproduction Number
Figure A1 also shows the critical fraction of the populace that should be vaccinated in order to reduce Ro to 1, assuming an available vaccine is 100% effective. Vaccination effectively reduces Ro, providing “herd immunity” by placing a barrier of unsusceptible (immune) people between an infected person and someone without immunity. Note that measles, one of the most contagious of airborne diseases, requires a vaccination level of 90 to 95% of the populace. Recent outbreaks among population groups that have chosen or neglected to have vaccinations are teaching us lessons we should already know.
Although MERS (Middle East Respiratory Syndrome) a recent and very deadly disease (50% mortality) does not appear self-sustaining with a basic Reproduction Number less than 1, it can become self-sustaining within the built environment because a building’s Reproduction Number can be very different, as we will discuss.
Ro for airborne diseases can be reduced by increasing fresh air ventilation which dilutes the contagion. Minimizing contact time (isolation and quarantine) with infected persons and sanitizing surfaces are also important. In conjunction with vaccination (if a vaccine is available), fresh air, quarantines, and cleanliness combine to reduce Ro to levels that may stop disease propagation.
Airborne Disease Infectious Dosage and the Built Environment
Disease transmission models are complex assemblages of different modes of disease transmission and statistical models of infectious dosage. A model for airborne disease transmission from Rudnick and Milton is used for our article to display how ventilation and infection are interrelated. The model by Rudnick and Milton connects indoor carbon dioxide levels, assumed to be solely from occupant respiration, to infectious dosage levels. The analysis allows one to determine the probability of catching a disease based on indoor air quality (carbon dioxide), number of infected occupants, number of susceptible (non-immune) occupants, contact time, and disease. We use the trends predicted by the model to understand how increased ventilation reduces the probability of catching a disease and reduces the “building” Reproduction Number (Rao).
An infectious dose of a disease is called a “quanta”, which is not a physical entity, but instead, a statistical description of an amount of infectious “stuff” that results in a 63% probability of catching a disease. That is, if a person is infected with 1 quanta of a contagion, there is 63% probability they will develop the disease. The exponential nature of disease propagation results in 2 quanta increasing the probability to 86%, and 3 quanta increasing the probability to 95%.
An infected person “sheds” quanta based on the type of disease. For example, rhinovirus (common cold) shedding is estimated to be 4 quanta per hour per person, influenza virus shedding is estimated to be 100 quanta per hour, and measles is estimated to shed at 570 quanta per hour (Rudnick and Milton). The atmosphere in a building or room will contain an amount of quanta per air volume that is a balance of the number of infected occupants breathing relative to the air ventilation rate that dilutes quanta in the air volume.
A susceptible occupant in the room breathes quanta of the disease, and as the amount of quanta builds in their lungs, the probability of developing the disease increases. Carbon dioxide in the room acts as a “tracer gas” for the room occupants’ respirations. If half of the occupants are infected and half are susceptible, then half of the room’s carbon dioxide increase (above atmospheric level) has come from the lungs of an infected person. Therefore, a relation can be derived in terms of ventilation rate, room carbon dioxide concentration, number of infected persons, number of susceptible persons, disease quanta shedding rate, and probability of acquiring the disease.
A “building” Reproduction Number, Rao, can also be defined. Rao is a measure of the number of susceptible building occupants that can be infected by an infected individual, similar to the basic Reproduction Number, Ro, previously described. Reducing Rao is desirable, with a level less than 1 indicating an environment has been established in which disease propagation is unsustainable.
A series of plots (Figures A2-A6) show how the probability of influenza infection related to occupancy (infected versus susceptible occupants), room air quality (carbon dioxide concentration), and exposure time. A second series of plots (Figures A7-A9) shows Rao trends based on the same factors. We use these trends in our discussions of the home environment, public spaces (work, school, etc), and transportation systems (eg, air travel).
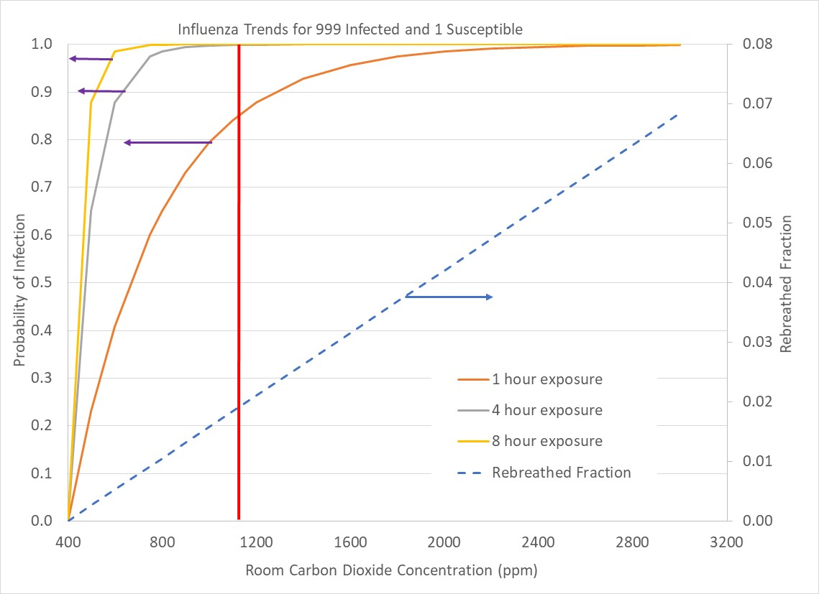
Figures A2-A6 show the progression of the infection probability decreases as the number of infected occupants relative to the number of susceptible occupants decreases. In Figure A2, a limiting case is depicted in which a room has 1000 occupants with 999 of the occupants infected. This situation is analogous to room in which a single infected person fills the room with contagion, followed a susceptible person entering the room. Figure A2 shows that the susceptible person should minimize the time spent in the room. The vertical red line marks the level of carbon dioxide concentration one would expect under current building ventilation standards (~20cfm per person). Doubling ventilation to 40cfm per person would reduce carbon dioxide concentration to 750ppm from 1100ppm, which would reduce the 1 hour exposure time probability from 85% to 55%.
Figure A3 presents the results for a room with 2 occupants, one infected and one susceptible. Because half of the room’s carbon dioxide came from the susceptible (uninfected) occupant, the concentration of quanta is half of Figure A2’s quanta level. Figure A4 progresses to a room with 10 occupants, 1 infected and 9 uninfected. Figure A5 displays a room with 30 occupants with 1 infected and 29 uninfected, and Figure A6 is a room with 100 occupants in which 1 is infected and 99 are uninfected. Overall, the probability of acquiring an infection is reduced as the fraction of uninfected occupants are in the room because the fraction of carbon dioxide (and associated quanta) from the infected individual is a smaller fraction of the room volume.
Figures A7-A9 show how the building Reproduction Number, Rao, varies as a function of occupancy (infected versus uninfected occupants), carbon dioxide concentration and contact time. Note that Rao for the cases with high infected occupancy (Figure A2) and a room with 1 infected occupant and 1 susceptible occupant (Figure A3) are not plotted because there are no excess occupants to infect beyond the one susceptible individual.
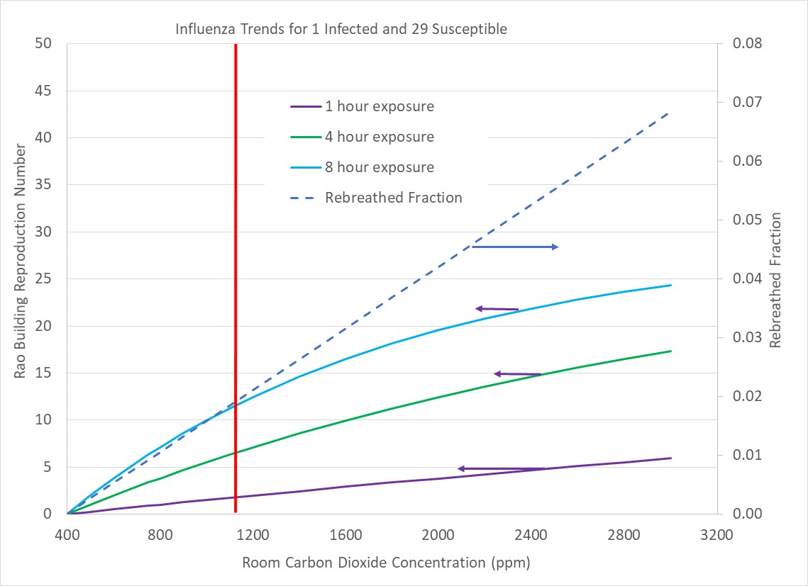
The trend observed in Figures A7-A9 contrast with the trends of Figures A4-A6. Whereas Figures A4-A6 show that one’s chances of becoming infected decrease as the number of susceptible occupants increases in relation to infected occupants, the number of people who are infected by the infected occupant increases. That is, you are less likely to be infected in a room with 1 infected occupant as the room becomes more crowded at a given air quality (carbon dioxide concentration). Unfortunately, the more crowded room has a higher building Rao number, indicating a more rapid spread of the disease.
Notice that in Figure A7 (1 infected occupant with 9 susceptible occupants), 8 hours of occupation with 2000ppm carbon dioxide concentration results infection spreading to all 9 uninfected occupants. Figure A8 shows that 8 hours in a room with 2000ppm of carbon dioxide results in 20 out of 29 occupants becoming infected. As the number of susceptible occupants increases relative to an infected individual, a limiting number of infections (Rao) is reached. Figure A9 shows that 27 occupants are infected out of 99 susceptible occupants.

