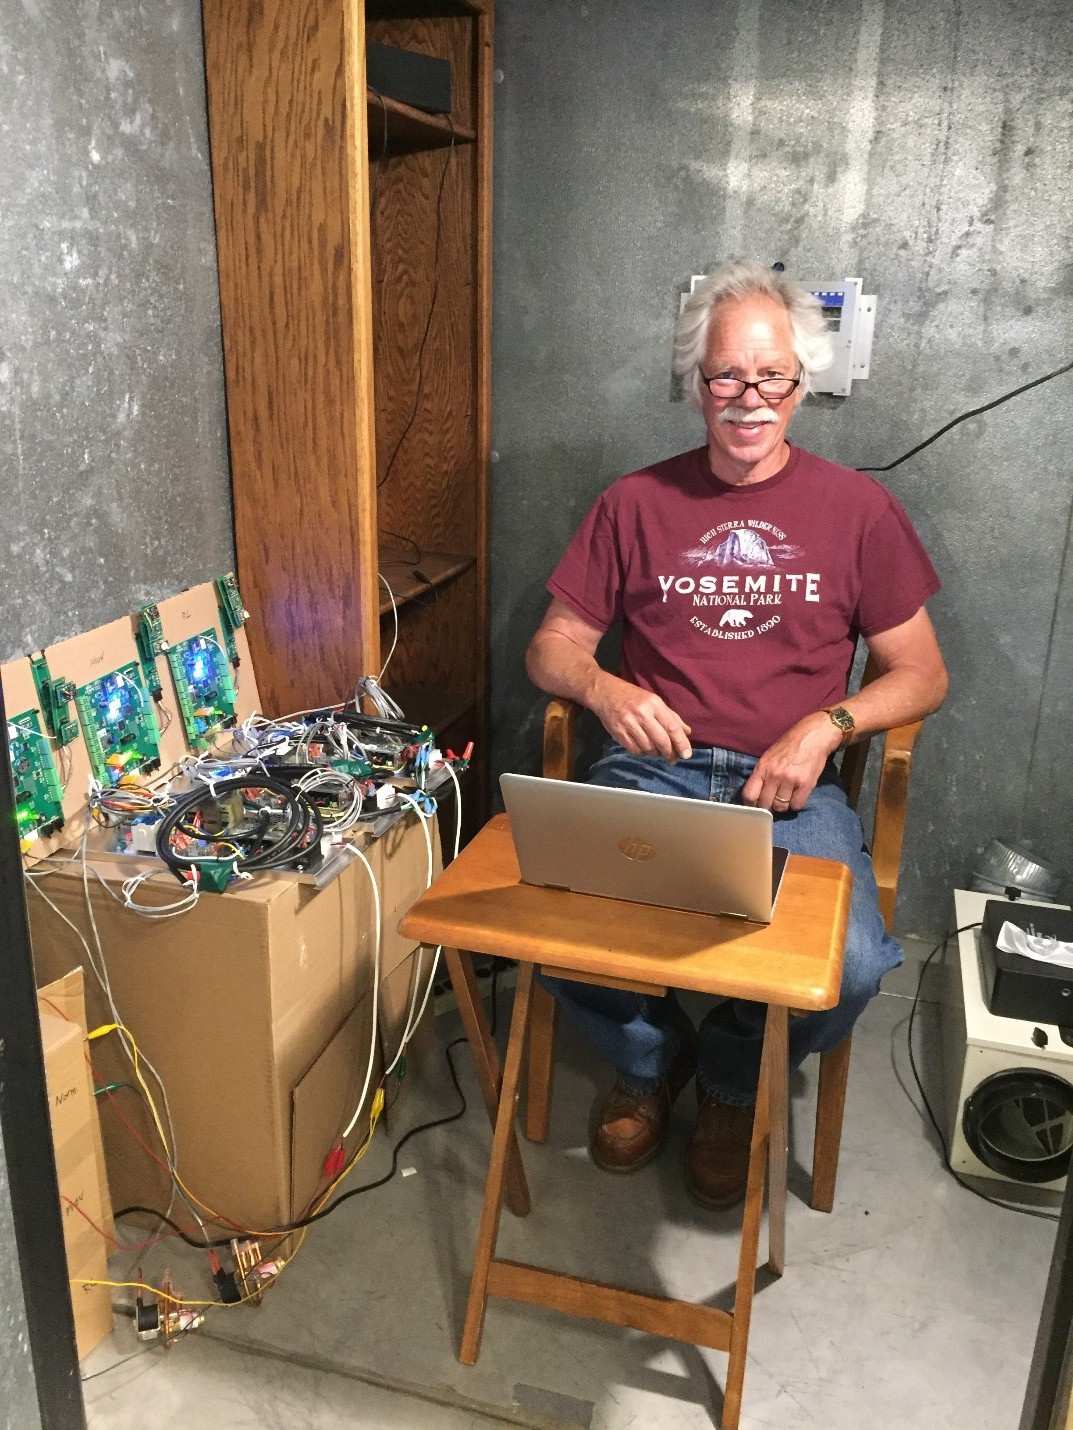
Ty is in the chamber again! This time, collecting data related to human VOC emissions.
In this article, we discuss VOCs, CERV2 measurement of VOCs, and Build Equinox philosophy for management of VOCs in homes. VOC management is a complex and evolving field, and Build Equinox continues to be at the forefront of VOC research within the home environment.
VOCs (Volatile Organic Compounds) are ”reactive” chemical compounds that exist in all environments. You cannot escape VOCs because you are a continuous emission source of VOCs! Table 1 shows estimated average human emissions for the 5 highest VOCs in human breath. VOC variation in human breath varies by as much as 25 times from high to low VOC emitting people.
Table 1 of most significant VOCs in human breath
 Source: “Human Breath Emissions of VOCs”, J.D. Fenske and S.E. Paulson, J Air&Waste Management Assoc, Vol 45, May 1999
Are VOCs good are bad? Well, there are good VOCs and bad VOCs. And some VOCs are “hormetic”. That is, an optimal concentration range exists that is good for your health, with too little or too much degrading health. Acetone, more commonly known as nail polish remover, is the most prevalent VOC in human breath. In addition to VOCs in our breath, we exude compounds through our skin. The 1 to 2 pounds of skin we shed each year contains VOC compounds such as the oil, “squalene”.
VOC discussions often become emotional debates, and for good reasons. Some of us (Ty) tend toward the “Think before you stink” philosophy of minimizing airborne chemicals, while others (Deb, Ty’s spouse and perhaps the only person in the world capable of living with him) are “Essential oils” enthusiasts who feel the scent of lavender or other essences are important for sleep, health, and well-being. The mental stress of worrying whether a VOC is good or bad may degrade your health more than VOC health impacts. We humans are complicated!
Human-only VOC Emission
Figure 1 shows a photo of a recently washed and clean clothed Ty ready for Ben and Alex to seal him in the chamber. Figure 2 shows carbon dioxide and VOC concentration data during Ty’s 1 hour stay in the chamber. The chamber door was propped open for 10 hours before the test, with somewhat noisy VOC data due to air exchange between the chamber and the laboratory ambient environment.
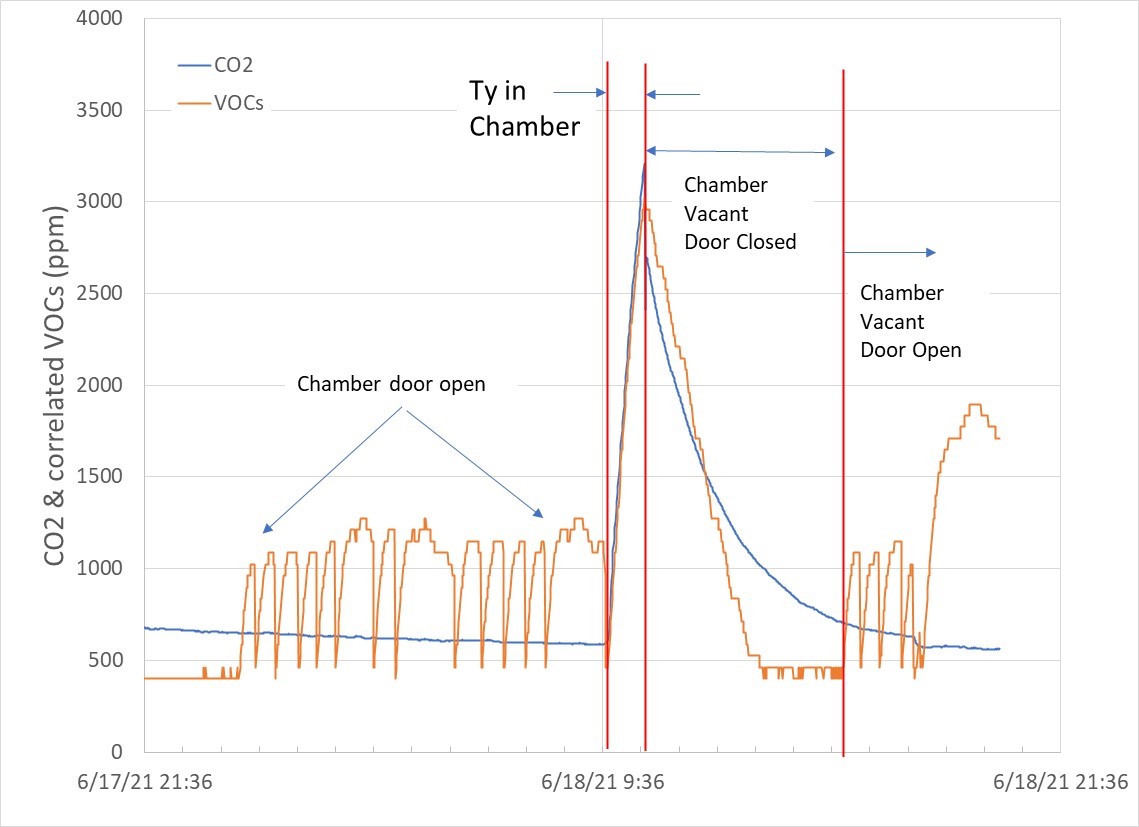 Figure 2 - Carbon dioxide and VOC concentration profiles during Ty’s chamber test. When the chamber door is left open, VOCs from the main laboratory environment periodically flow into the chamber. Note that VOCs decay faster than carbon dioxide because they can break down into other compounds.
Our environmental test chamber has metal walls, and is very old (not as old as Ty, but older than Ben and Alex), such that any volatile sealants and compounds used in chamber manufacturing have long ago evaporated. When the chamber door is closed, in the absence of a VOC emission source, our CERV2 VOC sensors detect no ambient VOCs within the chamber. A well-designed home with low and no VOC emitting furnishings should look like our empty chamber when unoccupied. We conducted this test during a time when the lab ambient environment CO2 and VOCs were low.
Ty’s 1 hour chamber stay was followed by a 5 to 6 hour vacant chamber period with the door closed. VOCs and CO2 concentrations decayed as air infiltrated and diluted pollutants. When the door was opened to the lab environment, VOCs within the chamber fluctuated with sporadic air exchange with the lab air.
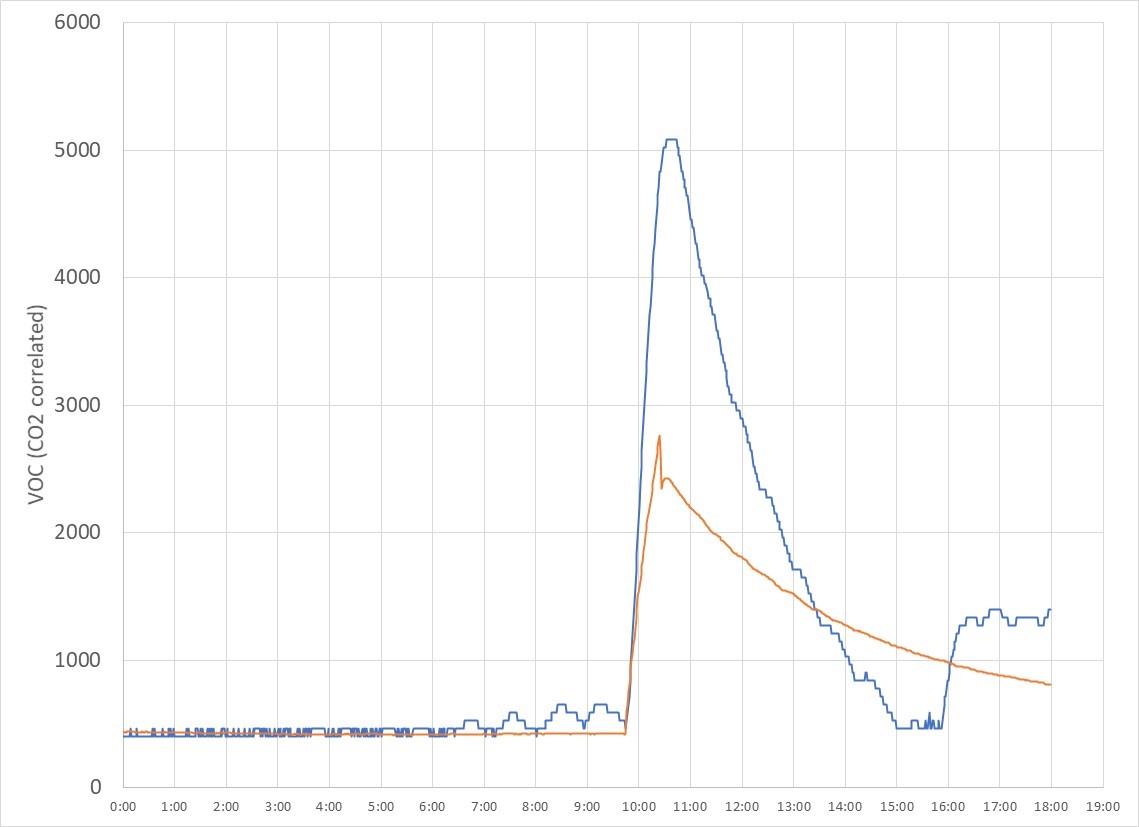 Figure 3 - Alex is known for his ability to consume food slathered with “5 pepper” rated hot sauces, and perhaps that is the reason for his disproportionate VOC to CO2 emissions on this test day. Regardless of the reason, it is very important to understand that there are no average human beings. There are humans that produce greater than average VOCs and those who produce less than average VOCs. The same individual on any given day will emit differing amounts of VOCs based on many factors.
Figure 3 shows a test with Alex doing computer work (“sedentary” metabolism) in the chamber. Alex’s VOC output is significantly greater than Ty’s. Although Ty is tempted to make a cheap joke at Alex’s expense, human VOC output varies widely from human-to-human and from day-to-day for an individual. Eat a bunch of garlic or drink a 6 pack, and your VOCs are going to change. Alex’s elevated cognitive processing activity coupled with his copious consumption of high Scoville scale hot sauces may contribute to his prolific biochemical emissions.
Correlated VOC Scale
Figure 2 above shows that carbon dioxide and VOC concentrations increase in a similar manner. Table 1 (shown earlier) shows VOCs in our breath are measured in “ppb” (parts per billion) and much lower in concentration than CO2 “ppm” (parts per million) concentration levels. Build Equinox uses a “correlated” scale between human VOC output and human’s CO2 respiration output. If the only source of pollution within a room (or test chamber) is people, our correlated VOC scale increases in a similar manner as CO2.
The reason for creating a correlated scale is to provide perspective between CO2 and VOCs polluting an indoor space. This has the advantage of providing CERV2 users with a simple means for understanding whether VOCs are likely to be from human (or animal) or non-human VOC sources. When the VOC to CO2 ratio is greater than 1, non-human VOC emission sources may be substantial.
Notice how VOC concentration decreases faster than CO2 after Ty leaves the chamber in Figure 2. The reactive nature of VOCs provides these compounds with other pathways for disappearing from the chamber in contrast to CO2 that relies of dilution for removal. VOCs breakdown into other compounds (such as water and carbon dioxide), and they are absorbed into room furnishings. Some VOCs photochemically breakdown in the presence of sunlight.
Human and Non-Human VOCs Mixtures
In general, human and non-human VOC sources are additive for an overall VOC loading of a home. Build Equinox has been studying VOCs in homes for several years, and our field studies show time and time again the importance of material selection. Even though one may select “no” and “low” VOC materials, the only way to know VOC concentration is to measure it. Human olfactory capability does not have the ability to smell healthy air, and many unhealthy VOC emissions from materials and furnishings are below our odor sensing capability.
We first learned that lesson in 2013 when our friends at Vermod rolled their first four “identical” homes off the assembly line. Three of the four homes registered low VOCs as expected with Vermod’s careful attention to low VOC emitting furnishings. The fourth home had amazingly high VOC concentrations. What could be the difference? Our first gen CERVs were new to the market in 2013, so the first thought was that perhaps our VOC sensing technology was at fault. The sensor seemed to be responding properly. When fresh air was brought into the home, VOC concentrations were lowered, but during air recirculation periods, the fourth home would increase in VOCs while the other three did not.
Further research by Vermod and Efficiency Vermont tracked the difference to a replacement countertop. Special “no VOC” laminated countertops had been ordered for the homes. One of the four countertops arrived damaged. The replacement was presumably a “no VOC” countertop, but was not. The replacement did not “smell” and it looked identical to the others. Without VOC sensing, you would not know the difference. After replacing the replacement countertop with a no VOC countertop, VOCs dropped to the same concentration as the other three homes.
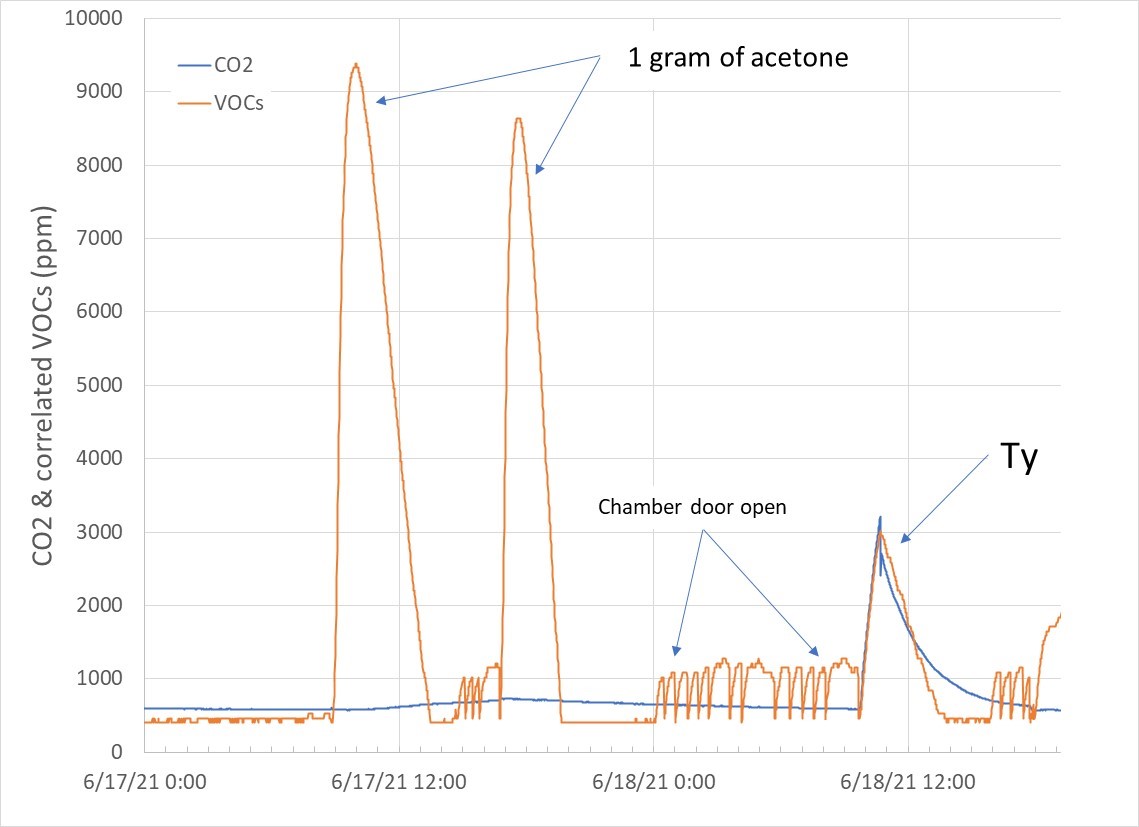 Figure 4 - Two closed door chamber tests were conducted prior to sealing Ty in the chamber. 1 gram of acetone released into the chamber. Note that acetone (and most other VOCs) do not impact carbon dioxide sensor readings.
Figure 4 shows two acetone emission tests conducted prior to the Ty test. 1 gram of acetone was sealed in a plastic container with a clean paper towel. The container was opened and placed in the chamber, allowing the acetone to evaporate from the paper towel into the chamber space. Correlated VOC concentrations increased to 8500 to 9000ppm for the tests, followed by a decay to the no VOC level (400ppm in CO2 correlated units). Notice that our CO2 sensor, based on infrared light absorption, is not impacted by acetone. That is, our CO2 and VOC sensor technologies are independent measurements. Both measurements are critical for managing air quality. VOC measurement is not a substitute for CO2 measurement, and vice versa.
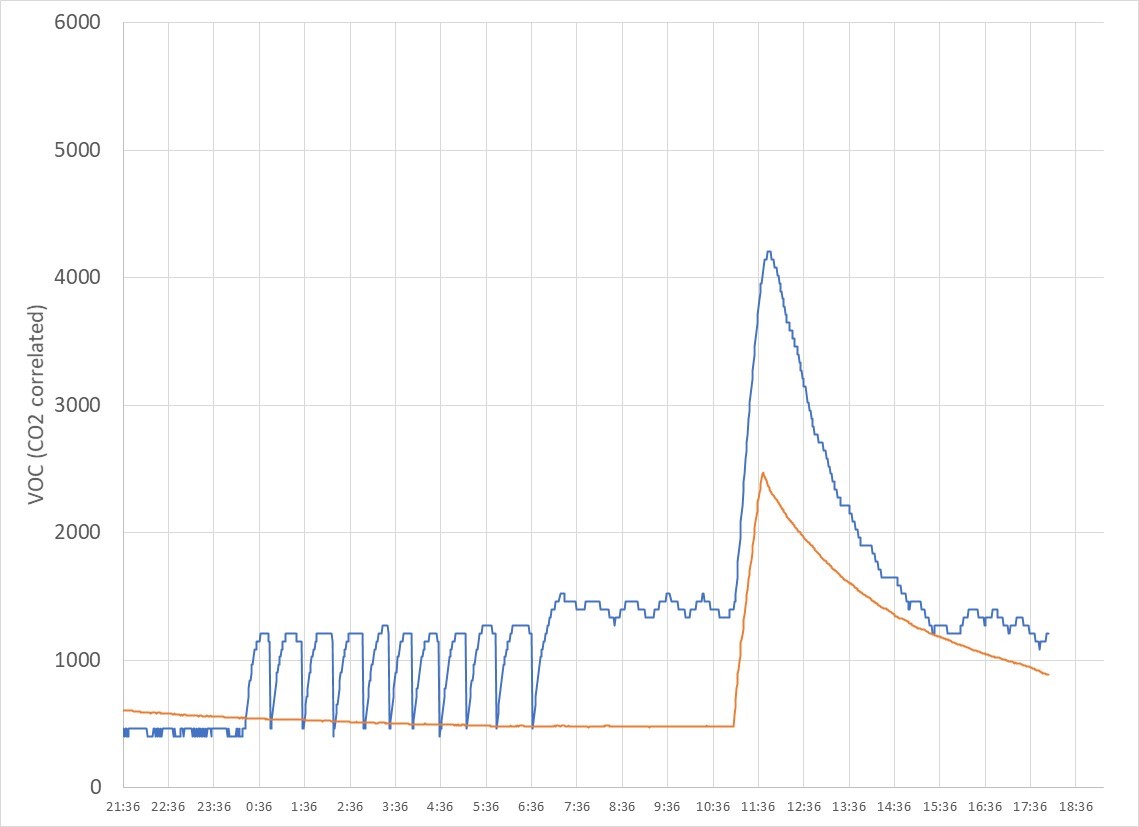 Figure 5 - Ty was sealed in the chamber during a day when the background VOCs at our Build Equinox facility was relatively high due to manufacturing operations. Note that Build Equinox uses a CERV2 to manage its fresh air, of course! Ty’s VOC output is layered on the background VOCs, demonstrating that our VOC sensors compound VOC emissions from humans and other VOC emission sources.
 Figure 5 shows another Ty test in which the laboratory environment had a higher VOC ambient concentration. The chamber door was fully opened prior to the test to “fill” the chamber with the lab’s ambient air. When Ty entered the chamber, lab ambient CO2 was low while lab ambient VOC level was high due to manufacturing activities. The additive nature of VOCs is apparent in Figure 5 as Ty’s VOC contribution layered on top of elevated ambient VOCs. In homes with elevated VOCs, occupant VOCs will add to the home’s environmental VOCs, triggering a CERV/CERV2 fresh air ventilation event when an owner specified pollutant threshold is attained.
Formaldehyde
Non-human VOCs, such as formaldehyde-based materials, are everywhere. You must be diligent in seeking out “no” and “low” VOC materials. The more our suppliers hear requests for healthy material choices, the more these materials will become available.
Elimination of formaldehyde from our indoor environments is important. Formaldehyde-based materials cause cancer, irritate our respiratory system, and degrade our homes (formicary corrosion).
Lumber Liquidators “certified” flooring exposed many families to excessive levels of formaldehyde. If formaldehyde can destroy copper, imagine its impact on your lungs. 120,000 formaldehyde-soaked “Katrina trailers” distributed after Hurricane Katrina continued the storm’s historic destruction.
The California Department of Public Health (CDPH) formaldehyde emission guidelines for homes lists an upper emission rate of 5.4micrograms/sqm-h from floors and ceilings. Walls should have no more than 2 micrograms/sqm-h of emission. A 2000sqft home with 2000sqft of floor, 2000sqft of ceiling, and 2000sqft of walls, results in formaldehyde emissions of 2400micrograms per hour. Interestingly, one person emits 2400micrograms of VOCs per hour based on average human breath emissions from Table 1. A home with CDPH level formaldehyde emissions adds human VOC emissions, resulting in fresh air ventilation events triggered by VOCs rather than CO2 similar to the combined VOC levels shown in Figure 5.
Natural Gas and Propane
The transition to a fossil free future will take time, but hopefully not too much time. During the transition, home occupants with natural gas and propane must be vigilant. Explosive mixtures of these gases have destroyed many homes.
VOC sensors are capable of sensing gas leaks. In one new home with CERV ventilation, consistently high VOC levels were tracked to a natural gas leak at the clothes dryer. In another CERV home with propane cooking, a faulty pipe connection was found to be responsible for high VOC concentrations. In both cases, gas concentrations were below the home owners’ sense of smell.
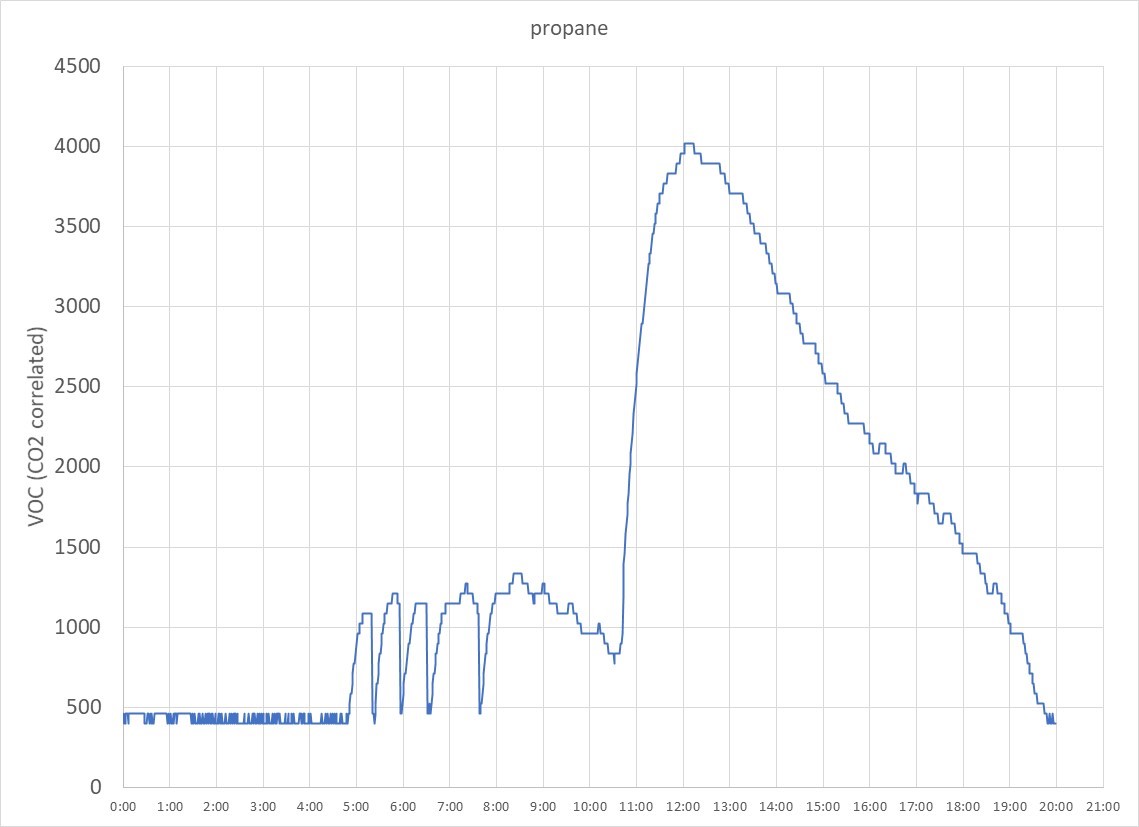 Figure 6 - CERV2 VOC sensors detect hydrocarbons, such as propane as shown in this plot. A propane concentration of 6.4grams per cubic meter was released in our test chamber, well below propane’s LEL (Lower Explosion Limit) of 39grams per cubic meter.
Figure 6 shows our VOC sensor response to the release of 0.75 cubic feet of propane in our test chamber. Propane concentration in the test chamber was 6.4 grams per cubic foot, which is substantially lower than propane’s LEL (Lower Explosive Limit) concentration of 39 grams per cubic foot. Notice that the propane concentration is high enough to trigger a CERV/CERV2 fresh air ventilation event, which can help keep explosive gases below their LEL.
Summary
We hope we have provided useful information related to Build Equinox’s VOC measurement and control sensing. VOCs are complex, VOC emissions are dynamic, and VOC impact on our health and well-being can be important. Human occupants should be the primary source of VOCs in any indoor environment. Smart ventilation systems with integrated VOC sensing automatically adjust fresh air ventilation to VOC concentration levels. Non-human VOC emission sources should be minimized, which in turn, reduces energy impacts associated with ventilation.

