Introduction
Some contagions, such as rhinoviruses (one of the common cold viruses) and influenza viruses, can be transported as aerosols expelled from our breathing. Many of these droplets can stay airborne for long periods of time. Poor ventilation control leads to concentrations of infected aerosols that increase our chances of becoming infected. Active control of air quality and filtration of recirculated air are two ways in which smart ventilation systems can significantly reduce the probability of disease transmission. Not getting sick avoids pain and suffering (as well as saves money)!
Cost of Influenza and Colds
Several diseases can be spread through airborne particles [1]. We focus on influenza (“flu”) and non-influenza viral respiratory infections (“colds”) in this article because of their prevalence and cost, however, the comments are applicable to other airborne transmissible diseases.
The cost of “epidemic” influenza (annually occurring flu) in the US is estimated to be $87 billion per year [2]. Somewhat more than half of the cost is due to “indirect” cost such as lost work and death. Direct costs associated with doctor visits, hospitalization, and medications account for less than half. Additional costs are incurred during “pandemic” influenza (non-seasonal influenzas transmitted worldwide) occur.
Colds (non-influenza viral respiratory infections) are estimated to have an annual cost of $40 billion dollars per year in the US [3]. Direct medical costs are estimated to be $17 billion per year in the US while indirect cost are estimated to be $23 billion per year.
To add some perspective to these costs, when all US households become energy efficient, the cost of renewable energy for supplying all of our household energy needs will be $160 billion per year. Approximately $80 billion per year of household energy needs will be for comfort conditioning and $80 billion per year will be required for other household energy uses. Among the other things we like or need energy for are refrigerators ($5 billion per year) and hot water ($15 billion per year). That is, a modest 10-20% reduction of the prevalence of the flu and colds is ten times more valuable than a similar improvement to our refrigerators and hot water systems. And, we feel better, too!
Airborne Disease Transmission
Disease transmission pathways are very complex because many disease agents can be transmitted in multiple manners from direct contact (touching, direct sneeze or cough), contact with “fomites” (objects that have been in contact with an infected person), and airborne aerosols. Animal test subjects, such as guinea pigs housed in separated cages are one means for demonstrating airborne disease transmission [4]. Guinea pigs have the interesting human characteristic of sneezing after catching a cold, which is beneficial for researchers monitoring disease spread. Recent developments for monitoring genetic materials from viral infectious agents coupled with high resolution aerosol monitoring equipment allow in situ collection of airborne disease transmission data among humans [5,6,7,8]. Small, almost perpetually airborne respiration droplets have been found to contain nearly 9 times more infectious viral particles than larger respiration droplets that settle quickly.
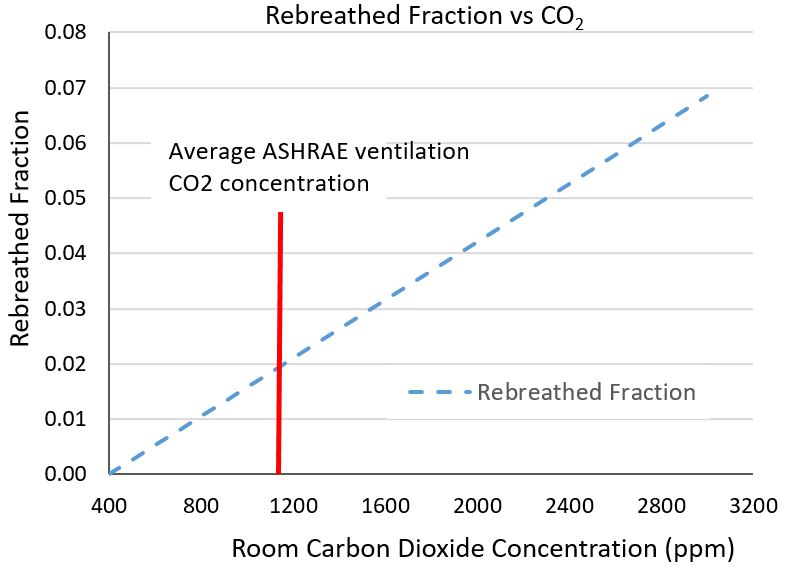 Figure 1 Fraction of air “rebreathed” in a building based on carbon dioxide concentration.
Poor air quality increases the probability of getting sick. Rudnick and Milton [9] developed a form of the Wells-Riley relation that links the probability of becoming infected to the concentration of carbon dioxide in a building. Figure 1 shows how carbon dioxide within a building is related to the fraction of air that we “rebreathe” from ourselves and others.
If you are the only inhabitant of a building, then all of the exhaled breath you are breathing is your own, but if there are 100 occupants in a room, then only 1% of that exhaled breath is yours. With a nominal 15-20cfm per person ventilation rate, indoor CO2 would be 1100ppm with “sedentary” (office work) activity, resulting in a rebreathed fraction of 1.8% (see red line in Figure 1). Yes, it is pretty creepy thinking in these terms, but it is important to understand this link between air quality and disease. Florence Nightingale (1859, Notes on Nursing) knew this when she wrote: “Badly constructed houses do for the healthy what badly constructed hospitals do for the sick. Once insure that the air in a house is stagnant, and sickness is certain to follow.” Why don’t we know this anymore???
We will examine the probability of getting sick in low occupancy buildings (homes) in relation to the air quality and type of disease (colds and flu). We will also examine how smart ventilation can further reduce the probability of becoming infected in a low occupancy building through filtered recirculation.
The spread of infectious disease is a community issue, and we must all contribute in a positive manner for our individual benefit and for the benefit of others. We will finish with a discussion of airborne disease transmission in high occupancy buildings such as schools, workplaces and other public gathering places because this is how someone in our households brings home infections.
Probability of Getting Sick in Low Occupancy Buildings (Homes)
We humans like to gamble. Gambling does not have to be in a casino. We make choices every day that gambles with our health and our well-being. We like to think that bad things only happen to others. Because of our tendency to think in this manner, we neglect to take the time, expense, or precautions to improve odds in our favor. That is, many of us prefer to leave it to chance that we won’t get sick rather than becoming proactive to reduce the odds of getting sick. Yes, bad things will still happen. Even though I exercise and mostly eat right, I may still have a heart attack or stroke, or develop dementia or cancer. Reducing my odds of getting sick through better air quality management does not eliminate getting sick, but, it definitely reduces my chances of getting sick.
In Michael Lewis’s book, The Undoing Project (2016), the lives and work of two celebrated psychologists are biographied. Lewis presents fascinating discussions of their research into the characteristics of human decision making. For example, when faced with a life-and-death decision, the manner in which a doctor describes a situation can significantly impact decisions we make. Being told that an operation has a 90% chance of success is more likely to persuade us to choose the procedure. If instead we are told that we have a 10% chance of dying, many would reverse their decision and not elect the surgery.
As we look at the probability of getting sick, let’s think in two manners in case one is more motivating than the other. For example, if a 20% chance of becoming infected versus a 40% chance of becoming infected doesn’t seem so significant, perhaps viewing the 20% probability as doubling the chance of not getting sick is a more positive view that would encourage better air quality management. Remember, the cost of flu and colds totals $1000 per household per year in the US, with potential savings that dwarfs many other means of saving money while also increasing health and well-being.
The “rebreathed” air fraction in Figure 1 is an important parameter in the Wells-Riley model developed by Professors Rudnick and Milton [9]. An additional parameter is the “quantum”, which is a statistical quantity describing an infectious agent dosage. An infectious agent concentration of 1 quantum per cubic meter results in a 63% probability of getting sick. Yes, 63% seems like an arbitrary, odd number, however it is rooted in a very definite expression. For those mathematically inclined, you’ll recognize that this is an “e-folding”, or “1-exp(-1)” expression we commonly see in many natural systems.
Different diseases shed quanta of infectious agents at different rates. A quantum is not necessarily an indication of a quantity of viral, bacterial or fungal particles. Instead, it represents a combination of an amount of infectious agent coupled with its potency. For example, one disease might require 2 particles for one quantum (ie, 63% chance of getting sick) versus another than might require 10 particles for one quantum chance of getting sick.
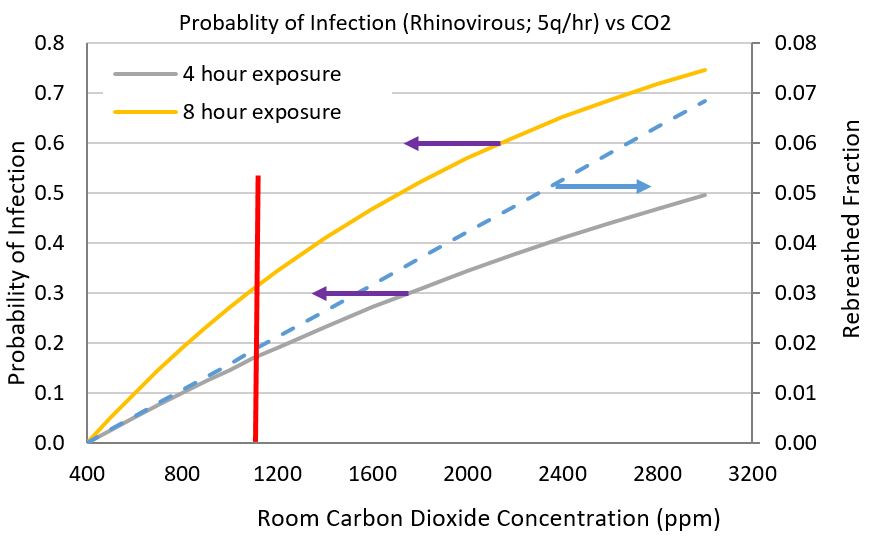 Figure 2 Probability of becoming infected after 4 hours and 8 hours with a cold (Rhinovirus; 5q/hr) in relation to room carbon dioxide concentration. Two people, one infected and one susceptible are assumed.
Cold viruses are shed at lower rates (1 to 10 quanta per hour per person) in comparison to influenza viruses (10 to 100-plus quanta per hour per person). Measles are especially virulent, shedding 500-600 quanta per hour, which indicates the importance of “herd protection” through vaccination and quarantined isolation to stop its spread. Figure 2 shows the probability of catching a cold from a person with a rhinovirus shedding 5 quanta per hour. From our monitoring of indoor air quality in many homes across the US, we regularly observe carbon dioxide concentration exceeding 2000ppm in homes with uncontrolled ventilators and unventilated “leaky” homes. The problem with uncontrolled ventilation systems (eg, simple HRV/ERV systems), whether or not balanced, is that occupants do not know how much ventilation is needed to maintain good air quality. Our noses cannot smell CO2 nor can we smell disease agents. The difficulty with leaky homes is that where leaks occur and where occupants live are two different things. The mechanical room, laundry room and kitchen might have 90% of the infiltration while bed rooms and living areas are stagnant.
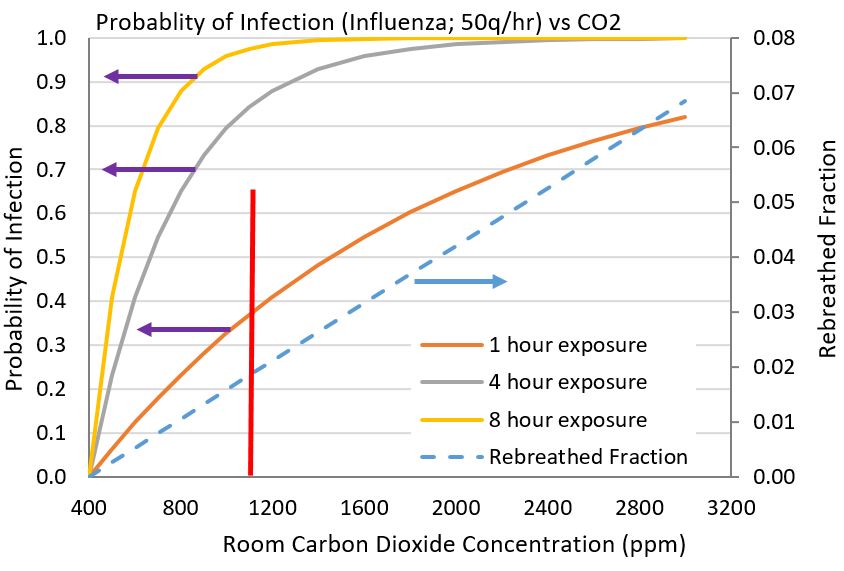 Figure 3 Probability of becoming infected with influenza virus with a shedding rate of 50q/hour.
Active control of CO2 and total VOCs allows one to continuously keep carbon dioxide concentrations under control, which automatically keeps quanta of infectious agents at reduced levels. From Figure 2, a home that has an excursion of CO2 to 2400ppm has a probability of 40 to 65% of becoming infected while a smart ventilation system with a CO2 threshhold setpoint of 900ppm (our recommended CERV setpoint), reduces the probability to 15 to 25% during 4 to 8 hours of continuous exposure.
A more aggressive virus, such as influenza, requires much tighter control of air quality in order to provide some chance of not becoming sick when in the presence of an infected person. Figure 3 shows how rapidly the probability of becoming sick with the flu increases with exposure time and increasing levels of carbon dioxide. At carbon dioxide levels above 2000ppm, susceptible persons will most certainly become sick after a few hours of exposure. Maintaining carbon dioxide concentration below 900ppm provides some reduction of infection probability. The importance of reducing exposure time is also important.
Reducing the Probability of Getting Sick with Filtered Recirculation
The CERV smart ventilation system provides additional protection and reduction of the probability of infection with filtered recirculation operation. The efficacy of filtering infectious aerosol particles has been demonstrated with surgical masks [10]. In a home, recirculating indoor air through a MERV 13 removes up to 90% of bioaerosol particles [1].
We utilize a bioaerosol prediction model based on a derivation by Professor Nazaroff [1] for determining the quantum concentration (quantum per cubic meter) within a home. Important house parameters are infiltration (air exchange rate), number of infected house occupants, fresh air ventilation rate, and filtered recirculation rate. Prediction of the quantum concentration allows the probability of infection to be calculated.
We consider three scenarios:
- 1) Unventilated home that only relies on infiltration
- 2) Ventilated home with 40 cfm of constant fresh air flow (balanced, exhaust, or supply type ventilation systems)
- 3) Ventilated home with averages of 40cfm of fresh air flow and 120cfm of filtered (MERV 13) recirculated air
Our modeled “house” is assumed to have one infected occupant. Case 3 represents a smart ventilation system in which 160cfm of fresh air is applied when needed, and during times when indoor pollutants (CO2 and total VOCs) are below setpoint thresholds, the unit operates in a recirculation mode. In order to be equivalent to the fresh air flow assumed for case 2, case 3 operates in fresh air mode for 25% of the time and in filtered recirculation mode for 75% of the time.
Figure 4 shows how the three cases compare for a house occupant with a cold virus shedding 5 quanta per hour. A conventionally constructed home without any ventilation is three times more likely to spread the virus than a smart ventilation system with filtered recirculation. As homes are sealed to high performance levels such as Passive House standards (0.6ACH at 50 Pa), the differences between a smart ventilation system and other systems grows. An unventilated home at supersealed conditions would build to undesirable odor and pollutant levels that would motivate most people to add ventilation. The addition of a simple, one-and-done ventilation system, whether balanced or not, would be 3 times more likely to pass an infection to susceptible house occupants. Note that Figure 4 shows that the smart ventilation keeps infectious quanta levels quite low, similar to its characteristics described in January’s newsletter for effectively managing particulates.
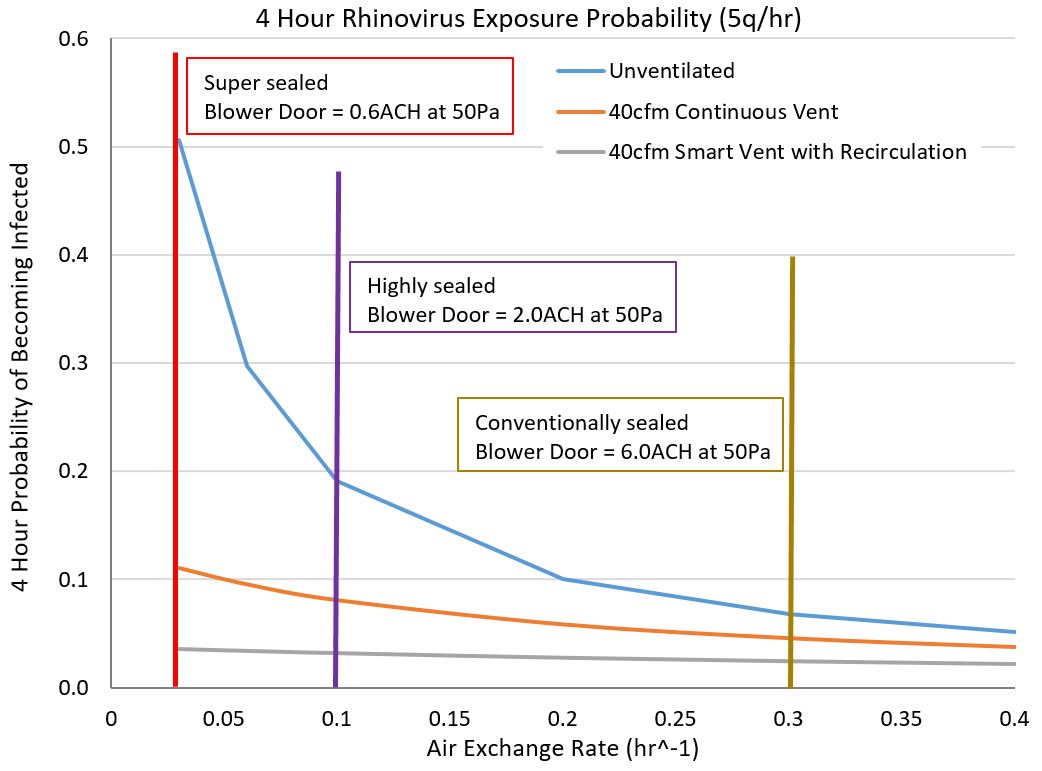 Figure 4 Comparison of unvented (case 1), constant ventilation, (case 2), and smart ventilation (case 3) for a home with one person infected with a cold virus.
Figure 5 compares the three ventilation cases with a more aggressive infectious agent, such as influenza. The case differences are even greater than Figure 4, with a smart ventilation system (case 3) keeping the probability of infection transmission below 30% in a super-sealed home while a simple ventilation system (case 2) grows to 70% probability of disease transmission, and an unventilated home (case 1) would almost certainly infect any susceptible visitor within a 4 hour time frame. Note that a smart ventilation system with recirculation can also incorporate other sanitizing capabilities such as ultraviolet (UV) treatment of the recirculated air.
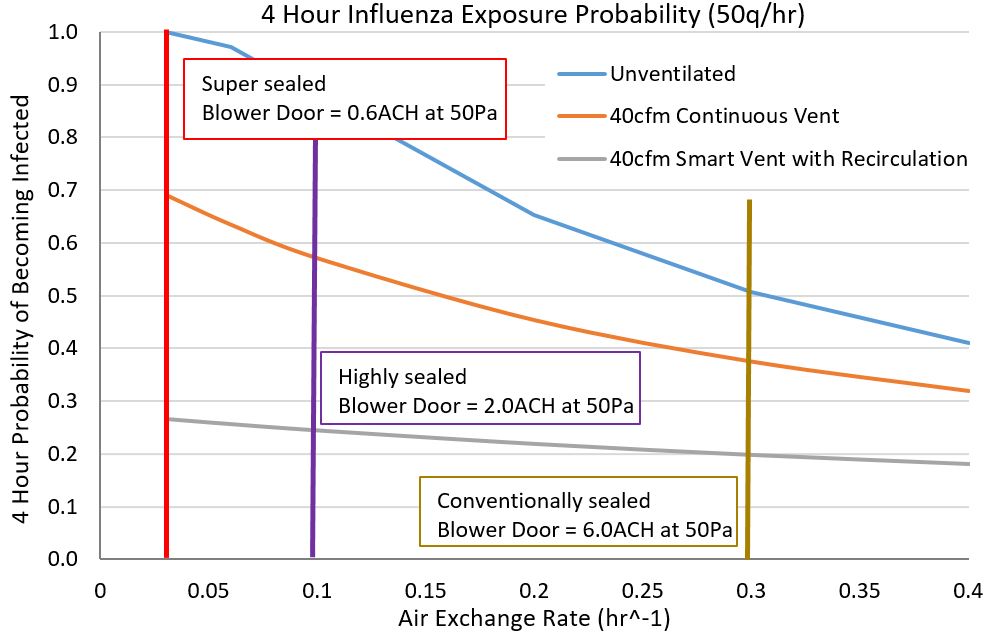 Figure 5 Comparison of unvented (case 1), constant ventilation (case 2) and smart ventilation (case 3) for a home with one person infected with a flu virus.
Transmission of Airborne Disease in High Occupancy Buildings
We bring sickness to our homes from other places. High occupancy environments are places with a high probability of infectious contagions. Anyone who has flown knows they are likely to catch a cold or the flu during airline travel (“traveler’s cough”). Figure 6 shows air quality data collected on a boarding bridge between the airport gate and the aircraft. This is data we collected from a very busy international airport (yes, Build Equinox is also involved in making air quality better everywhere). Fresh airflow through the aircraft is reasonably high relative to the number of passengers, and the airport’s ventilation is very good as indicated by low carbon dioxide concentrations within the airport terminal. Boarding bridges, however, are often a neglected, stagnant space with severe under-ventilation. Boarding periods are times when pollutants and contagions are especially concentrated because we are packed like sardines on the bridges.
The good news is that we can do something to reduce our chances of getting sick in high occupancy locations, and that the economic payback is substantial. In a previous Build Equinox newsletter, we described research showing that doubling today’s ASHRAE ventilation standard could increase employee cognition productivity by $6500 per year with an estimated ventilation cost of only $40 per year per employee in the harshest of US climatic regions. Implementing enhanced ventilation in commercial buildings, schools and other high occupancy locations will have the added benefit reducing our probability bringing infections to our homes.
Can we reduce colds and the flu by 10% or more through more effective ventilation? Yes, we can!
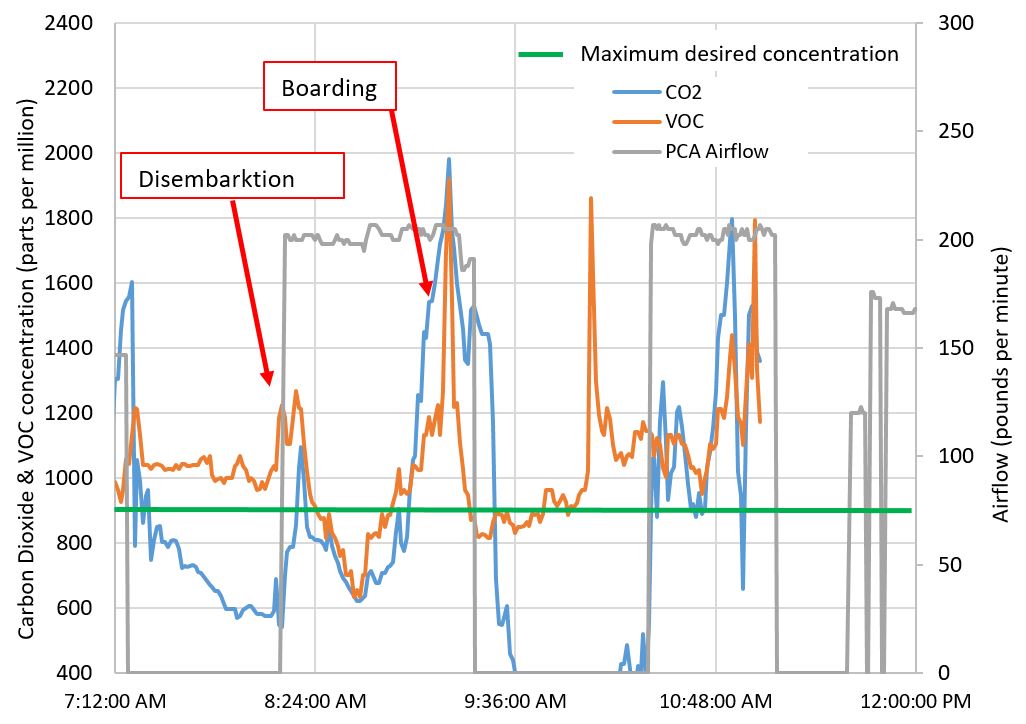 Figure 6 Boarding bridge air quality (CO2 and total VOC concentrations) and aircraft airflow at an international airport. PCA airflow is ventilation air flowing through the aircraft (100 pounds per minute of airflow equals 1400cfm).
[1] WW Nazaroff, “Indoor Bioaerosol Dynamics”, Indoor Air, 26, pp61-78, 2016
[2] N-A. Molinari, I.R. Ortega-Sanchez, M/L. Messonnier, W.W. Thompson, P.M. Wortley, E. Weintraub, C.B. Bridges, The Annual Impact of Seasonal Influenza in the US: Measuring Disease Burden and Costs”, Vaccine, 25, pp5086-5096, 2007
[3] A. Mark Fendrick, Arnold S. Monto, Brian Nightengale, Matthew Sarnes, “The Economic Burden of Non–Influenza-Related Viral Respiratory Tract Infection in the United States”, Arch Intern Med, 163, pp487-494, 2003
[4] Anice C. Lowen, Samira Mubareka, John Steel, Peter Palese, “Influenza Virus Transmission Is Dependent on Relative Humidity and Temperature”, PLoS Pathog 3(10): e151. doi:10. 1371/journal.ppat.0030151, 2007
[5] Jordan Peccia, Donald K. Milton, Tiina Reponen, and and Jane Hill, “A Role for Environmental Engineering and Science in Preventing Bioaerosol-Related Disease”, Environ. Sci. Technol., 42 (13), 4631-4637, DOI: 10.1021/es087179e, July 2008
[6] Chad J. Roy, and Donald K. Milton, P.H.Airborne, “Transmission of Communicable Infection — The Elusive Pathway”, New England J of Medicene, 350;17, 2004
[7] Theodore A. Myatt, Sebastian L. Johnston, Zhengfa Zuo, Matthew Wand, Tatiana Kebadze, Stephen Rudnick, and Donald K. Milton, “Detection of Airborne Rhinovirus and Its Relation to Outdoor Air Supply in Office Environments”, American J of Respiratory and Critical Care Medicene, 169, pp1187-1190, 2004
[8] Patricia Fabian, James J. McDevitt, Wesley H. DeHaan, Rita O. P. Fung, Benjamin J. Cowling, Kwok Hung Chan, Gabriel M. Leung, Donald K. Milton, “Influenza Virus in Human Exhaled Breath: An Observational Study”, PLoS ONE 3(7), 2008: e2691. doi:10.1371/journal.pone.0002691
[9] Rudnick SN, Milton DK (2003) “Risk of indoor airborne infection transmission estimated from carbon dioxide concentration”, Indoor Air 13: 237–245
[10] Donald K. Milton, M. Patricia Fabian, Benjamin J. Cowling, Michael L. Grantham, James J. McDevitt, “Influenza Virus Aerosols in Human Exhaled Breath: Particle Size, Culturability, and Effect of Surgical Masks”, PLoS Pathog 9(3), 2013: e1003205. doi:10.1371/journal.ppat.1003205

