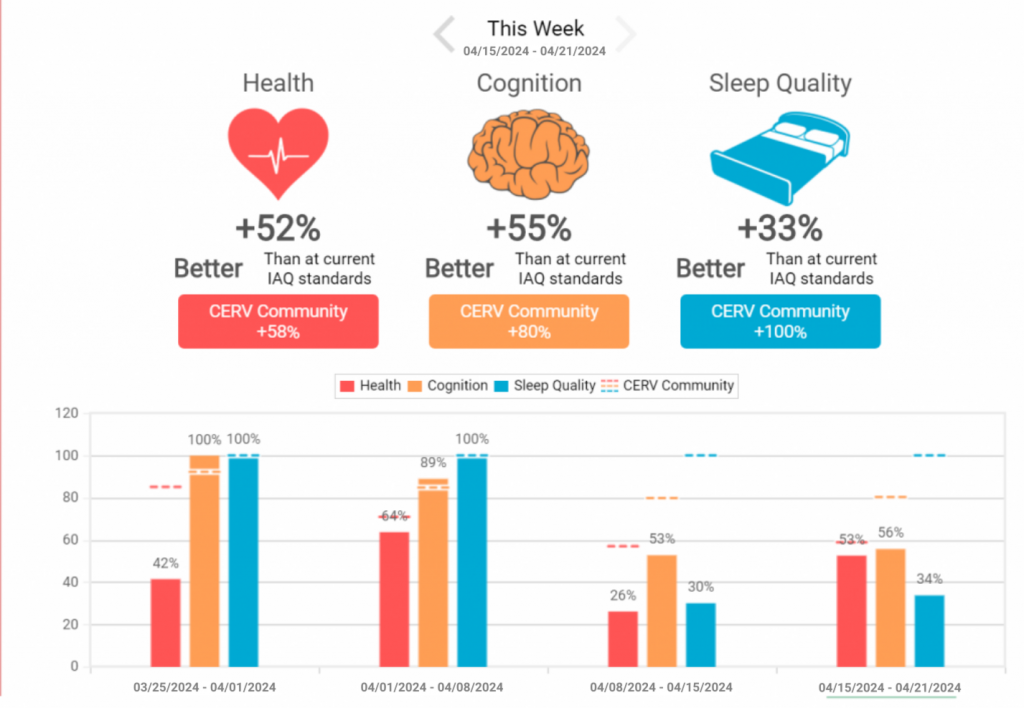
CERV Analytics offers users invaluable insights into the intricate relationship between air quality, health, cognition, and productivity. Unlike conventional systems, CERV-ICE captures and archives all data without imposing fees, subscriptions, or intrusive advertising, ensuring unfettered access to critical information at any time.
At the heart of the Analytics lies a comprehensive array of metrics meticulously crafted to empower users in understanding and managing their indoor air quality. This multifaceted approach includes three primary sets of metrics: Personal metrics, Exposure metrics, and Basic metrics. Each set serves a distinct purpose, catering to different facets of the air quality spectrum. Personal metrics, for instance, zoom in on immediate factors influencing well-being and cognitive performance, such as elevated carbon dioxide levels and volatile organic compounds (VOCs).
The significance of these personal metrics becomes apparent when considering their tangible impact on daily life. For example, research has shown that even at typical ventilation levels, a carbon dioxide concentration of 1000 to 1100ppm can result in nearly a 15% decline in cognitive performance. By assigning economic values to these declines, users gain a pragmatic understanding of the potential costs associated with suboptimal air quality, offering a compelling incentive for proactive management.
Moreover, the Analytics delve into more nuanced aspects of air quality, such as its influence on sleep quality. By leveraging real-time data from the CERV system, users can gain insights into their sleep environment and make informed adjustments to optimize restorative rest.
Beyond personal metrics, the Analytics also encompass Exposure metrics, which track long-term pollutant exposure. By charting exposure levels over time, users can monitor the cumulative impact of their home environment on health, empowering informed decision-making and proactive interventions. This perspective is invaluable for understanding trends and identifying potential areas for improvement.
The Basic metrics section provides users with raw pollutant concentration data, offering a foundational understanding of air quality dynamics within their homes. By examining metrics such as the ratio of VOC to CO2 concentrations, users can gain insights into the sources and composition of indoor pollutants, facilitating targeted interventions and optimization strategies.
As Build Equinox continues to refine and expand its Analytics feature, users can expect ongoing advancements in the field of residential air quality management.
Related Articles
newspaperCERV-ICE IAQ Analytics Explained
newspaperHealthy Indoor Air Quality Standards: Carbon Dioxide (CO2)
newspaperHealthy Indoor Air Quality Standards: Volatile Organic Compounds (VOCs)
newspaperHealthy Indoor Air Quality Standards: Particulates (PC0.3 and PM10)
newspaperHealthy Indoor Air Quality Standards: Carbon Monoxide & Radon

