

Related Articles
newspaperHealthy Indoor Air Quality Standards: Carbon Dioxide (CO2)
newspaperHealthy Indoor Air Quality Standards: Volatile Organic Compounds (VOCs)
newspaperHealthy Indoor Air Quality Standards: Carbon Monoxide and Radon
Active particulate management is essential for maintaining healthy indoor environments. Sources of particulates should be reduced as much as possible. Sealing homes from outdoor particulates coupled with fresh air filtration and recirculation-filtration of indoor air are essential for maintaining low indoor particulate concentrations. As expressed by Professor Caleb Finch, “There is no safe level of particulates”.
In the article on VOCs (Volatile Organic Compounds), we discussed the release of more than 220 chemical compounds from human respiration and skin. Particulates are every bit as complex with shape, size, and composition variations. Some particulates are inorganic (eg, silica and salts), some are organic (eg, “squams” or skin flakes and dust mite dander), some are biological organics (eg, pollens, yeast, and molds), and some are microbial entities (eg, endotoxins, prions, viroids, viruses, and bacteria). And to complicate things even more, a particulate may be composed of all the above!
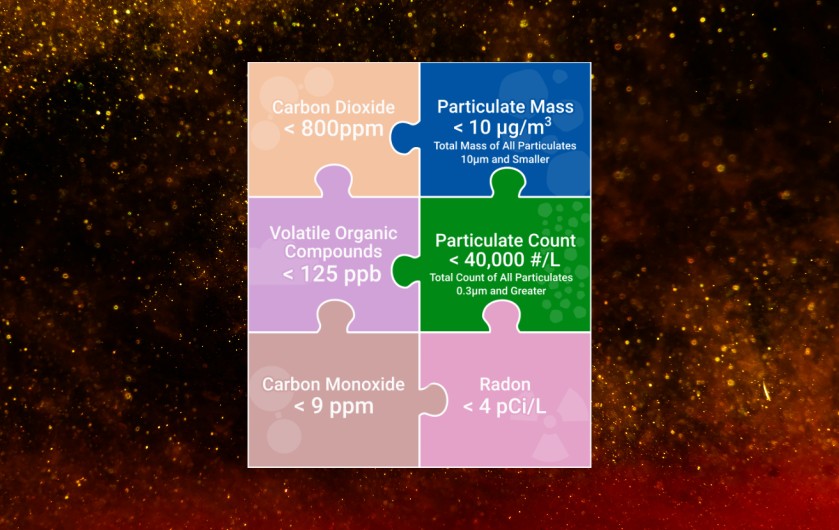
Build Equinox healthy Indoor Air Quality Standard (IAQS) consists of two particulate criteria:
1) Particulate Mass; we recommend “PM10”, the mass of all particulates 10 microns and smaller to be less than 10µg/m3 in indoor spaces
2) Particulate Count; based on our research with University of Illinois Environmental Engineering, we’ve created a new particulate category, “PC0.3” (PC zero-point-three), in which the total number (count) of particulates 0.3 microns and larger is kept below 40,000 particulates per liter.
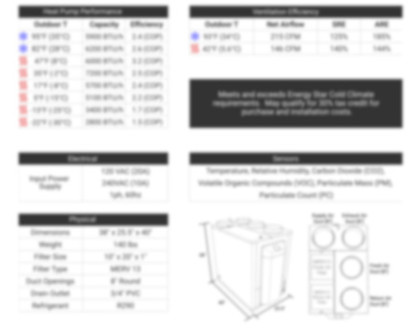
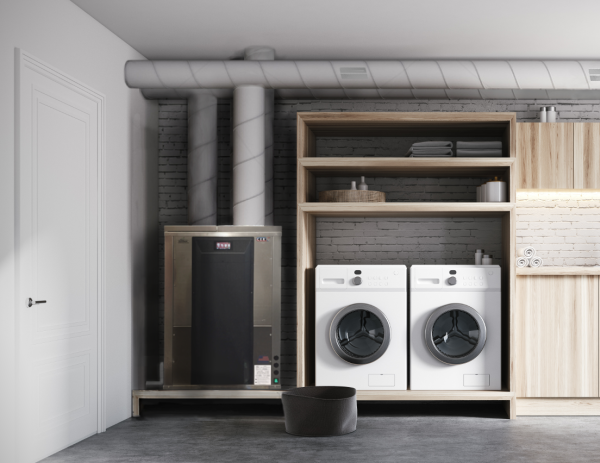
Our particulate management recommendations are more stringent and comprehensive than today’s EPA recommendations. Build Equinox healthy Indoor Air Quality Standard can be attained with today’s technologies as incorporated into CERV2 (residential and small commercial) and CERV-1000 (high occupant density indoor environment) smart IAQ management systems.
Introduction
Build Equinox recommends keeping particulate mass density less than 10µg/m3 and particulate count density below 40,000 particulates per liter. The combination of these two particle metrics characterizes particulate sources (eg, road dust versus wildfire smoke), and characterizes particle movements and interactions within our bodies.
Continued improvement in particulate mass sensing technology allows better particulate management. Sensors were unable to accurately monitor mass density less than 100µg/m3 just 10 years ago. Similarly, particulate counting technology has transitioned from a $10,000 laboratory instrument to an affordable sensor (<$100) for submicron particulate monitoring over the past 10 years. We provide background information on some aspects of particulates with links to additional articles from our research, followed by discussion of the basis for our two particulate criteria.
Particulate Background Information
Our January 2017 news article discusses particulates in homes. From our analyses, indoor generated particulates became more numerous than particulates from outdoor sources around 1980 as homes became better sealed. By the 1990s, homes without recirculating air filters (MERV 13 or better) were sealed sufficiently that total indoor particulate levels exceeded those in yesteryear’s leaky homes as well as being greater than outdoor particulate concentration.
The primary defenses against particulates are filters, filters and more filters. Filters for fresh air and filters for recirculation air. Covid helped inform people of the importance of air recirculation and filtration. Recirculation is essential in today’s high performance homes for reducing indoor generated particulates. Filter cost can easily exceed anticipated energy savings in high performance homes. Expensive filters cause a reluctance to replace filters as often as they should.
Indoor particulates and outdoor particulates are different. Nature cleanses outdoor air through its own filtration and ultraviolet sanitation processes. Our research shows colonies of bacteria living on an indoor filter while the outdoor filter had no living bacteria. Even a clean-looking indoor filter should be changed after 3 months to reduce microbe buildup. Better still, consider adding UVGI (ultraviolet germicidal irradiation) to kill microbes on the indoor filter.
As discussed in our January 2017 article, increased asthma incidence strongly correlates with decreased house air infiltration. Correlation does not mean causation, however, today’s synthetic materials create particulates that are much different than yesteryear’s indoor particulates composed largely of wood, metal, glass, stone, clay, leather, and natural textiles that we have lived with for millenia.
Endotoxins are tiny particulates, also called “LPS” (lipopolysaccharides), that are 1/10th the size of the Covid virus, and are very, very toxic. Endotoxins are remnants of the outer shell of “Gram negative” bacteria (Gram is someone’s name, not the mass measure). Decomposition of dead Gram negative bacteria breaks the outer shell into 1 to 2 million LPS particles! Indoor environments have higher concentrations of endotoxins than outdoor environments and are an important contributor to sick building syndrome. A tiny amount of endotoxin causes fatigue. A bit more causes severe fever. Your body never gets used to endotoxins, hence the name “Monday fever” as workers in high endotoxin environments (eg, textile and paper manufacturing) recover from endotoxin fever over the weekend only to become sickened again at work on Monday. Although not a trigger for asthma, endotoxins act as an “adjuvant” or amplifier of other substances that trigger asthma and other undesired immune system reactions.
Our bodies have an amazing array of defenses to remove particulates. Many inhaled particulates and chemicals dissolved from particulates are deposited into fluids (mucous) lining our respiratory system. Mucous transports particulates and chemicals upwards through our throat by continuous pumping action of waving hairlike structures (cilia) that line our respiratory track. We swallow and destroy some of them in our stomach acid while others are expelled by spitting and nose blowing.
Small particulates move deep into alveoli (small air sacs) where they can cross into the blood stream. Our immune system attacks particulates when it detects them. However, blood carries particulates throughout our bodies where they may accumulate in various organs. Some particulates stay lodeged in our lungs where they build up over time, potentially causing devastating diseases such as lung cancer and COPD.
Particulate deposition within our respiratory system is complex. “Large” particulates (greater than 1 micron) are nearly all deposited within our respiratory system when inhaled. Particulates larger than 2-3 microns are deposited in the upper respiratory track while smaller particulates move deep into the lower respiratory system. Particulates smaller than 0.1 micron are deposited within the respiratory system by “diffusional forces” rather than inertial forces that dominate large particle movement.
Curiously, intermediate sized particulates (0.1 to 1 micron) are not so easily deposited, with as little as 20% particulate deposition rates for particulates in the 0.2 to 0.4 micron size range. Our research collaboration with University of Illinois Environmental Engineering has investigated submicron particulates density in indoor spaces, resulting in a new hypothesis for airborne disease transmission. We have defined “fomite aerosols” as particulates that have infectious microbes attached to them during inhalation, and are then exhaled back into the indoor environment.
We can never have a dust free indoor environment because we are a fountain of particulates, generating as many as 100,000 to 10,000,000 particulates per minute! Our activities add additional sources of particulates from cooking to woodworking. And, polluted and dusty outdoor environment ladened with excessive particulates are an additional source that enter our homes with infiltration air.
The good news is that we can take proactive action to control particulates!
Two Particulate Metrics
Build Equinox Indoor Air Quality Standard has two particulate criteria:
1) Particulate Mass; PM10 < 10µg/m3
2) Particulate Count; PC0.3 < 40,000#/liter
The first metric, Particulate Mass, is the more common metric reported by particulate sensors. Our particulate mass recommendation more stringent than EPA’s particulate recommendations. As previously mentioned, EPA is working to lower their particulate recommendation to 10µg/m3 for PM2.5 in comparison to our 10µg/m3 for PM10. Our PM10 criterion covers a broader particulate size range than PM2.5. PM10 includes mass for all particulates 10 microns and smaller within a one cubic meter volume while PM2.5 covers all particulate mass for particulates 2.5 microns and smaller.
The PC (Particulate Count) criterion provides an important small particulate characteristic that “PM” measurements miss because PM emphasizes larger particles. Figure 1 shows data collected with Piera’s particulate sensor incorporated into a CERV2 smart ventilation system. Figure 1 data is from Equinox House, and shows typical particulate conditions in homes with CERV2 fresh air and whole house air filtration.
Figure 1 shows Equinox House to have 3.3µg/m3 for PM10, representing the mass of all particulates 10 microns and smaller within a one cubic meter volume. There are no 10 micron size particulates in a one liter volume. At 5 microns, PM5 is essentially the same as PM10 because relatively few particles are in the 5 to 10 micron size range are airborne. A liter volume of air is not likely to have any 5 micron particles.
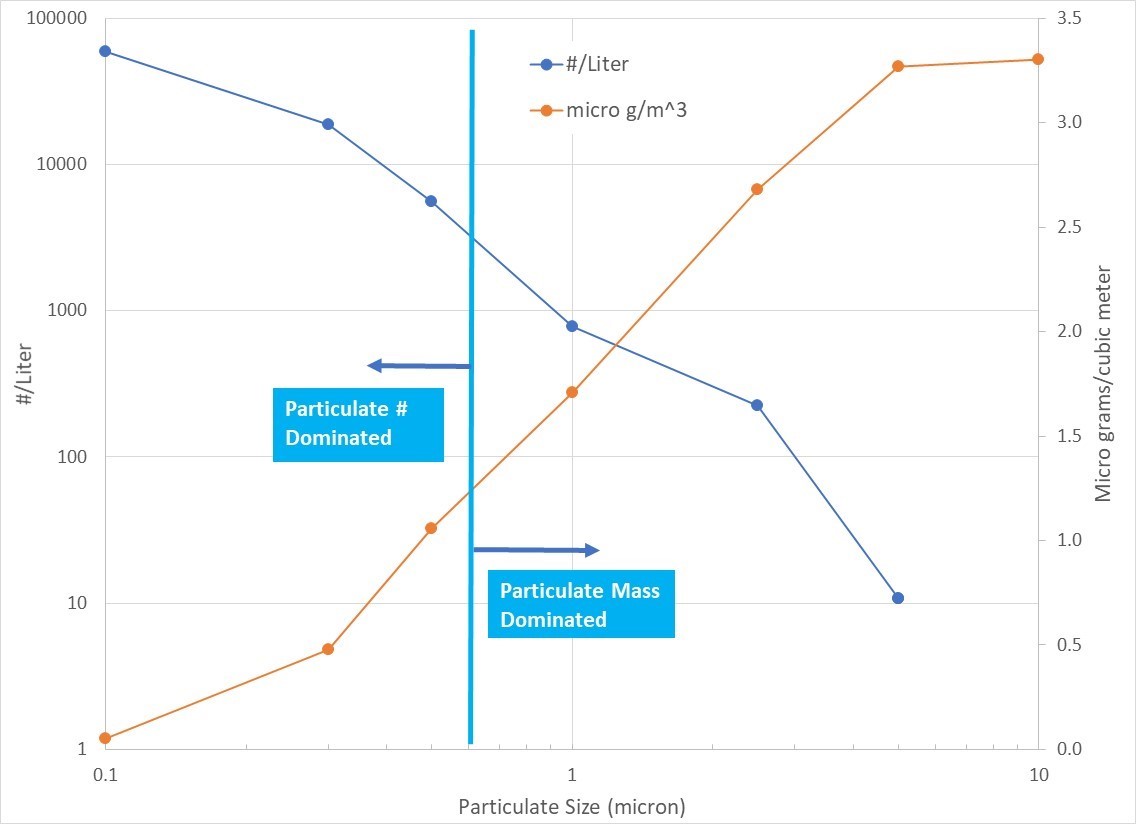
Figure 1 shows that particulates become more numerous and particulate mass contribution decreases as particulates decrease in size. At 0.3 micron particulates, PM0.3 (particulate mass for all particulates 0.3 microns and smaller) is only 0.4 µg/m3, or contributing only 12% to the overall particulate mass, while 15,000 particulates in the 0.3 micron size range are in each liter of air! Over the course of a day in Equinox House’s clean indoor air environment, a person breathing 8 liters per minute inhales nearly 175 million of these particulates!
Indoor environments without effective air filtration can easily have more than 100,000 particulates per liter, resulting in multiple particulates making their way into each of our more than 300 million alveoli (air sacs) every day. Our body’s ability to remove particulates is miraculous, but our lungs have a limit to their waste disposal capacity.
Figure 1 from Equinox House is 1/3 of our recommended PM10 limit of 10µg/m3 and PC0.3 limit of 40,000#/liter. Particulate conditions are very dynamic and conditions in Equinox House periodically exceed the particulate criteria as they do in any indoor environment. Indoor activities (eg, frying on a cooktop) and outdoor conditions (eg, windy days during fall harvesting with very high outdoor particulate levels) may temporarily increase indoor particulate mass and/or particulate count above our criteria, but in general, these are limited time exposure periods that are short in duration due to active air filtration.
Piera sensors report an “extrapolated” estimate of 0.1 micron particulate count value. UFP (ultrafine particulates) counts increase as size decreases, however we do not use the extrapolated value as part of our current particulate count criterion. We will continue to review the count criterion as sensor technology allowing true 0.1 micron particulate counting develops.
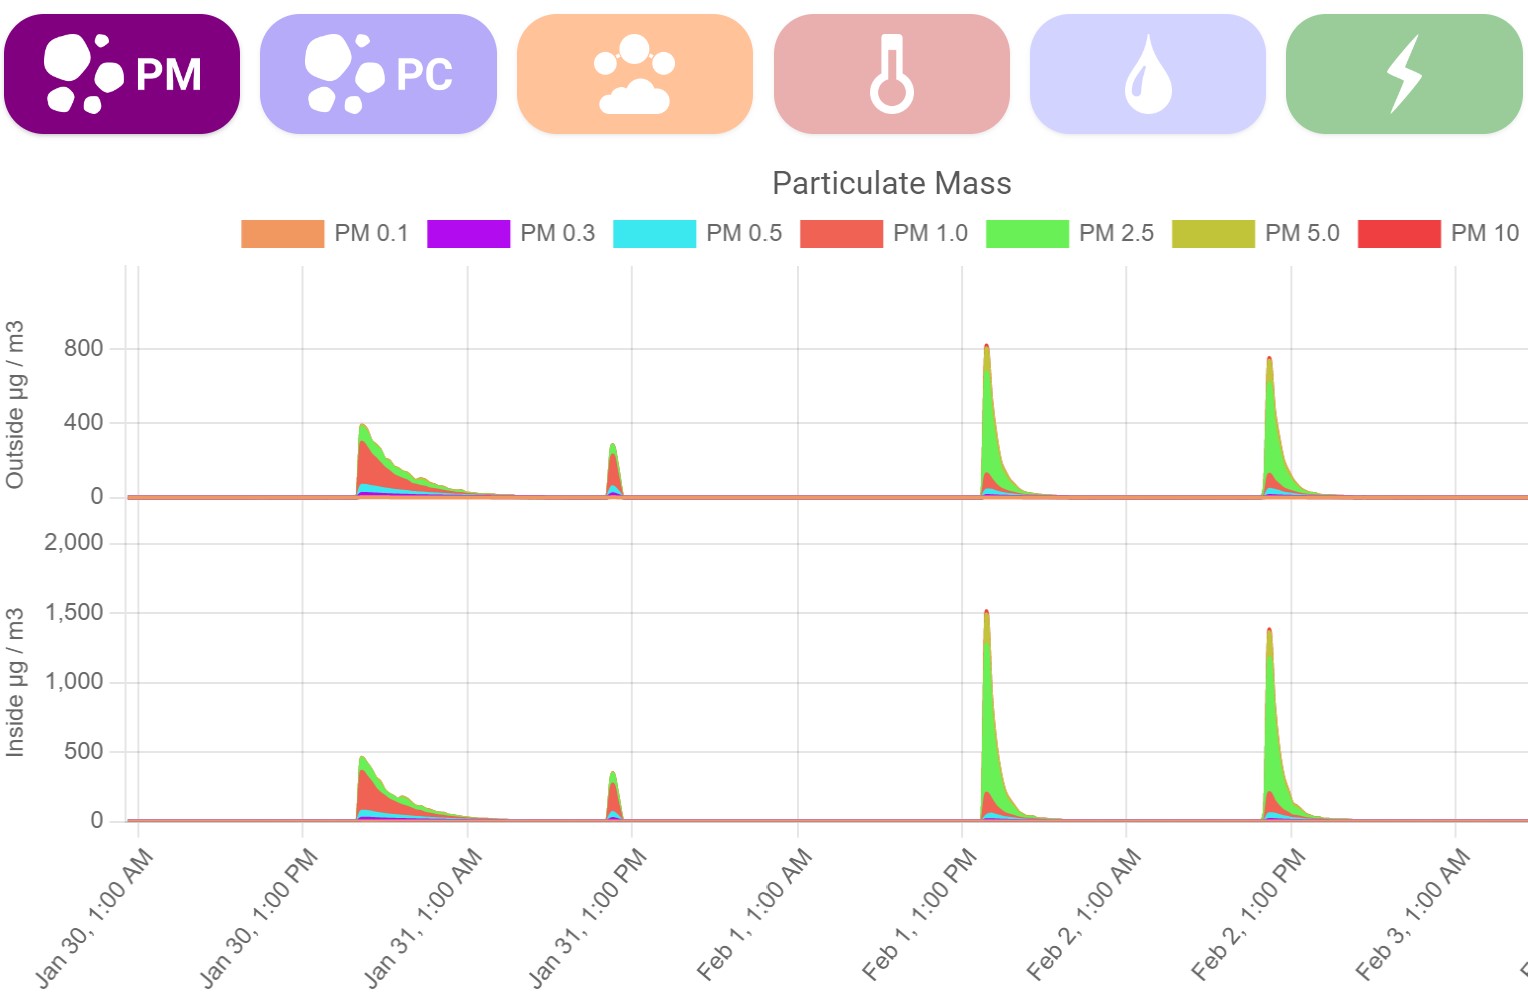
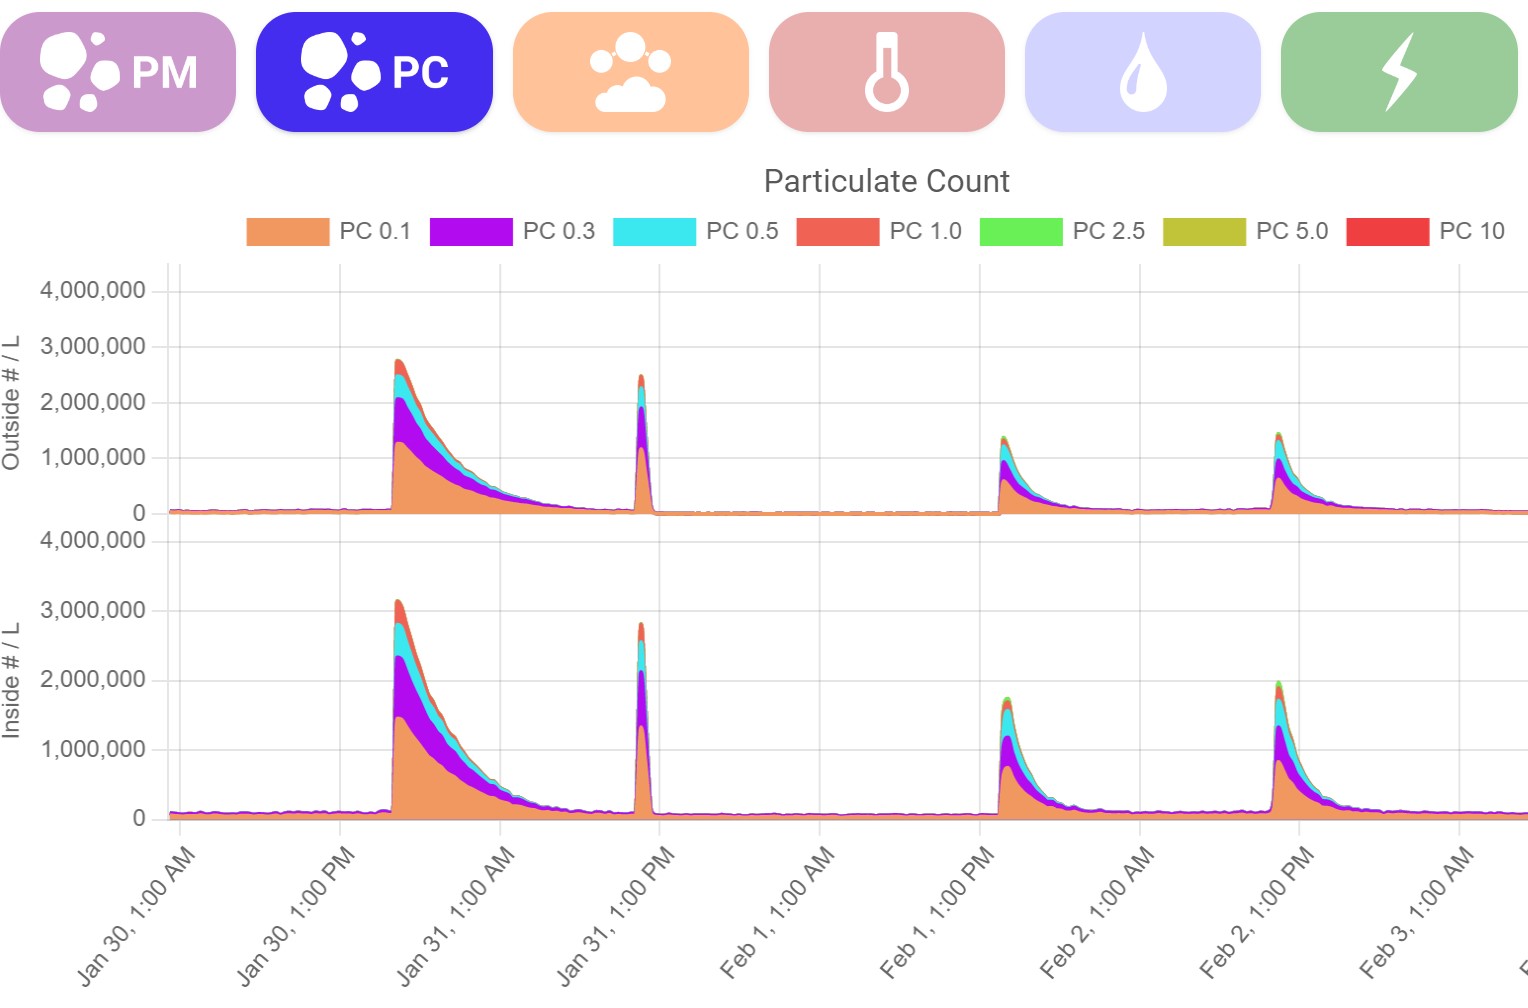
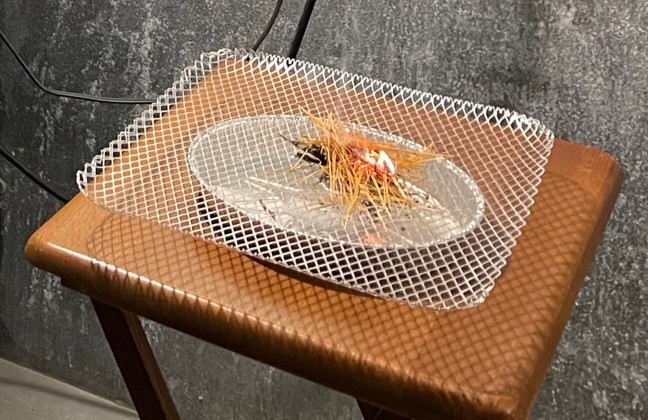
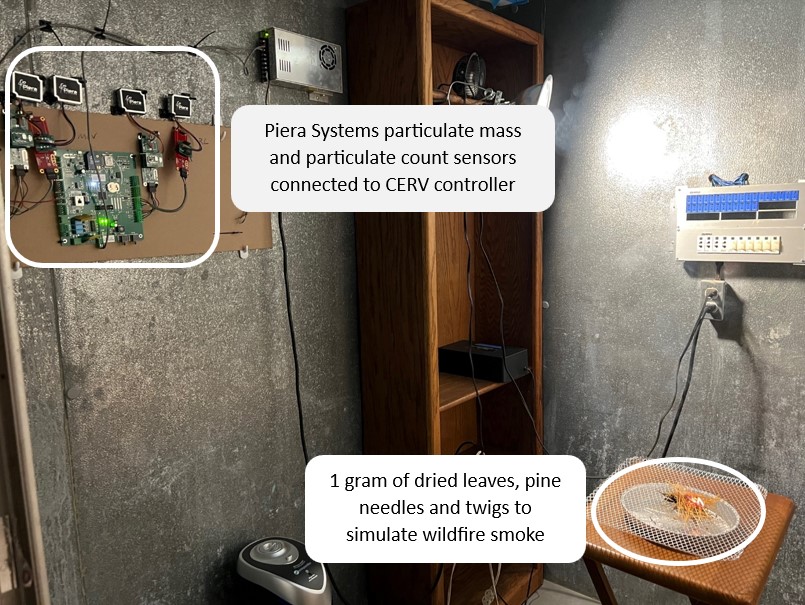
Figure 2 (particulate mass data) and Figure 3 (particulate count data) demonstrate the need for both particulate count and particulate mass measurements. The data was collected in Build Equinox environmental test chamber shown in Figure 4. The top and bottom data traces in Figures 2 and 3 are from two side-by-side Piera sensors in the chamber. The two traces on the left side of Figures 2 and 3 are from two fire experiments (see Figure 4). The fire consisted of 1 gram of dried leaves, pine needles and twigs to simulate wildfire smoke.
Figure 2 shows the two sensors (top and bottom traces) reached 400 to 500µg/m3 for both fire experiments (two events on left side of the top and bottom plots). The second fire trace shows the impact of circulating chamber air through a MERV13 filter at 200cfm (cubic feet per minute). The filter fan was switched on as the fire reached peak particulate loading. Filter effectiveness is readily noticed with the second fire’s particulates removed within a short time. Without active particulate filtration, smoke stayed airborne for more than 12 hours in the chamber.
Figure 3 shows particulate count trends for the same experiments. Both smoke experiments reached a peak of 3,000,000 #/liter. We included 0.1 micron particulates in the data to show increasing particulate count trend with decreasing particulate size. The chamber has a volume of 6m3, indicating that 18 billion particulates were generated by the small amount of dried leaves and twigs.
1800 active people releasing 10 million particulates per hour over the course of an hour are required for generating the same amount of airborne particulates as one gram of dried leaves and twigs! This provides some idea of how acres of burning forests are able to create such damaging air quality over vast areas. Remember that particulates released by humans are important, too.
The right two traces in Figures 2 and 3 are from two simulated road dust experiments conducted in the environmental chamber. Road dust was created by filling a 5 gallon bucket halfway with limestone “road pack” gravel from our driveway at Build Equinox (Urbana, IL). The bucket was placed in the chamber, and a 1” diameter paddle bit fixed in a drill was inserted into the bucket and spun at high drill speed for less than 1 minute. After stirring the gravel mixture, the door to the chamber was closed.
An important feature of Figure 2 is the prominence of 2.5 micron road dust (green portion) particulates to mass whereas the primary contribution to particulate mass for smoke are smaller 1 micron particulates. Figure 2 also shows road dust to have almost twice the particulate mass as the smoke experiments, whereas Figure 3 shows smoke to have twice as many particulates per volume.
Overall, Figures 2 and 3 show us the importance of both particulate mass and particulate count metrics. The combination of these measures provides valuable information about the likely source of particulates (eg, road dust versus wildfire smoke). Mass and count metrics also provide us with health risk information. Road dust is deposited more prominently in our upper respiratory track while a large number of smoke particulates moves deep into lower respiratory areas.
Summary
Build Equinox’s healthy Indoor Air Quality Standard for particulates are based on two important metrics that are measurable and controllable. Particulate Mass and Particulate Count describe the amount and number of airborne particulates. Some particulate sources create larger, more massive particulates while other sources generate smaller, more numerous particulates. These two metrics provide information that help identify a source of particulates such as dust or smoke.
Maintaining PM10 less than 10µg/m3 and PC0.3 less than 40,000#/liter are more stringent than today’s particulate standards (PM2.5 less than 12µg/m3). Homes with effective particulate fresh air filtration and air recirculation filtration can stay within these particulate levels. Build Equinox will stay at the forefront of particulate research and to guide criteria for keeping our indoor spaces healthy.
Related Articles
newspaperHealthy Indoor Air Quality Standards: Carbon Dioxide (CO2)
newspaperHealthy Indoor Air Quality Standards: Volatile Organic Compounds (VOCs)
newspaperHealthy Indoor Air Quality Standards: Carbon Monoxide and Radon