

Related Articles
newspaperHealthy Indoor Air Quality Standards: Carbon Dioxide (CO2)
newspaperHealthy Indoor Air Quality Standards: Particulates (PC0.3 and PM10)
newspaperHealthy Indoor Air Quality Standards: Carbon Monoxide and Radon
Volatile Organic Compounds, or VOCs, are gaseous, reactive chemicals in the air we breathe. Excessive VOC levels reduce productivity, degrade sleep, and cause acute and long term health problems. Active VOC management in our indoor environments is essential for keeping humans healthy and productive.
Build Equinox healthy Indoor Air Quality Standard (IAQS) recommends keeping “total” VOCs below 125ppb (parts per billion). In this newsletter, we discuss the impact of VOCs on our health, sources of VOCs, and the basis for Build Equinox healthy IAQ Standard’s 125ppb VOC recommendation.
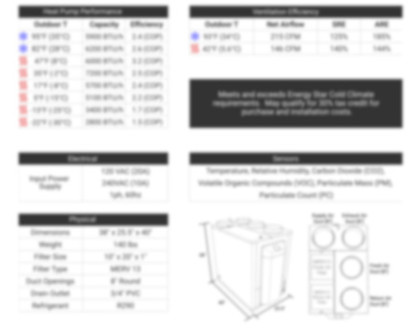
Build Equinox incorporated VOC sensors into our first generation CERV unit in 2010. CERV and CERV2 units have been continuously monitoring and controlling VOCs in homes throughout all North American climate zones since. Build Equinox understands VOC sources, VOC dynamics, and VOCs interrelationships with other indoor air pollutants. More importantly, we know how to automatically control VOCs to maintain healthy air in buildings so that you can have the peace-of-mind to enjoy life.
VOC Background

VOCs are a complex soup of gaseous chemicals present in the air we breathe. Some VOCs are bad, some are benign, and some are good. The smell of spring flowers, a pine forest, and Nature’s other pleasant odors are VOCs we identify with fresh, healthy air. Odors accompanying wildfire smoke, a paper mill, or other less pleasant smells trigger our brains into a stressful condition that impacts our health whether or not an odorous VOC is harmful.
Humans have difficulty detecting harmful VOC levels in indoor environments because our olfactory sense is attuned to high concentration “events”, attracting us to delicious food or repelling us from impending danger (smoke). Our olfactory sense acclimatizes to indoor air, causing us to become “nose blind” that further limits our ability to judge air quality.
Today’s VOC sensors detect VOC concentrations well below our sense of smell, allowing us to monitor and control air quality based on human health. Building occupants rather than other chemicals should be the primary contributor to indoor VOC concentrations. Other VOC sources add to those produced by our bodies. Some of these sources are intentionally created, such as fragrances and essential oils, some are due to our activities such as cooking and cleaning, and some are not related to human or human activities. Other VOC sources may be due to our selection choices of household furnishings, cleansers, etc, or they may be from sources over which we have no control such as outside air pollution.
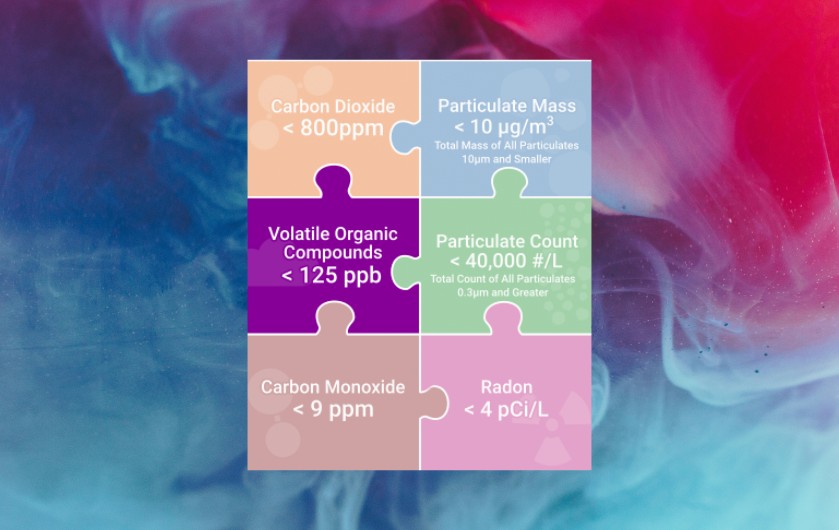
VOC characterization is complex, but understandable. More than 200 VOC chemicals are emitted by a human placed in a room. Build Equinox has established a rational, consistent set of air quality guidelines centered around human pollutant emissions. That is, our CO2 standard (CO2<800ppm) and VOC standard (VOCs<125ppb) are not independently derived, but are linked through expected levels of human CO2 and VOC emissions. Build Equinox particulate mass and particulate count recommended levels are similarly linked to human CO2 and VOC levels as we will discuss in next month’s newsletter article.
VOCs impact our productivity and sleep quality, which have important economic consequences. Our previous article discusses economic impacts of sick days and productivity in terms of CO2 concentration, however, VOCs are a primary factor causing these effects. CO2 has been used to correlate productivity and sleep because CO2 sensing technology is older than VOC sensing technologies.
Health impacts of specific VOC chemicals are also important for the following reasons:
• Acute, short term (1 hour) concentrations that cause health distress
• Longer term (8 hour workday) exposure concentrations that cause health distress
• Continuous exposure concentration levels that result in health issues
• Probability of developing cancer due to integrated exposure to an inhalable chemical
Risk assessment procedures of a particular chemical, such as formaldehyde, a common component of building materials and furnishings, are available for estimating health impacts. We will not discuss the computational procedures in this article, but refer interested readers to California’s excellent Office Environmental Health Hazard Assessment (OEHHA) “Air Toxics Hot Spots Program” guide and appendices. Also, OEHHA’s acute, 8 hour and chronic (long term) Reference Exposure Limits (REL) table is a quick resource for finding up-to-date information on health affecting chemicals. We will discuss OEHHA and ASHRAE recommended formaldehyde chronic exposure limits relative to Build Equinox IAQ Standard in this article.
VOC emission rates due to humans, human activities, and other sources, such as formaldehyde in furnishings and outdoor air pollution, are described below. We combine these VOC emission sources together and demonstrate how Build Equinox’s recommended 125ppb VOC IAQ Standard provides a basis for designing ventilation systems. Finally, we discuss the importance of combined CO2 and VOC air quality monitoring and provide illustrative examples for low occupant density (residences) and high occupant density (classrooms) situations.
Human VOC Emissions

A sterile, stainless steel enclosure with pure, sanitized air flowing through it will become filled with hundreds of VOC compounds as soon as a human is placed in the enclosure. Wang and co-authors placed four people in such a chamber to examine human and human-related VOC production (“Emission Rates of Volatile Organic Compounds from Humans”, N Wang, L Ernle, G Bekö, P Wargocki, and J Williams, Environ. Sci. Technol. 2022, 56, 4838−4848).
The humans were clean and wearing clean clothes provided by the investigators. Experiments were conducted with participants wearing shorts and short sleeve shirts in order to expose bare skin. Other experiments were conducted with participants wearing long pants and long-sleeve shirts for comparison to bare skin emission tests. Some test subjects were old, some were young, and some in between. Temperature, humidity and ozone impacts were also examined.
Wang and co-workers found an average VOC emission of 2180µg/h-person (+/- 620 µg/h-person) without ozone. Most VOC emissions were from exhaled breath. Variations of VOC output occurred due to clothing (long/short dress), age, and comfort conditions. The most significant variation was from ozone which more than doubled VOC emissions due to skin oil reactions with ozone producing volatile chemical compounds. Moderate ozone concentrations of 37ppb, about half of EPA’s 70ppb upper limit, were used in the experiment. With elevated temperature, shorts and short sleeves, and ozone, human VOC emissions exceeded 6000µg/h-person.
Tang and co-authors (“Volatile Organic Compound Emissions from Humans Indoors”, X Tang, P K Misztal, W W Nazaroff, and A H Goldstein, Environ. Sci. Technol. 2016, 50, 12686−12694) conducted a similar experiment in a classroom on the UC Berkeley campus. The authors similarly found human breath exhalation to be the dominate source of VOC emissions. The authors noted that an incredible 1840 human VOC compounds from human body fluids have been identified.
Tang, et al, found an average of 6250µg/h-person from their classroom experiments, similar to the ozone cases of Wang, et al’s more closely controlled experiments. Personal care products, hygiene and clothing are likely sources of elevated VOC emissions in Tang, et al’s classroom environment. Tang, et al did not monitor ozone so its potential impact is unknown but likely much lower than in Wang’s experiment.
Average total VOC emission rate for Tang, et al classroom experiments was 580mg/h, with 57% from students (331mg/h). Tang, et al experiments occurred in an urban environment (Berkeley CA), which elevated classroom VOCs and accounted for 35% of classroom VOCs (203mg/h). Indoor VOC sources accounted for 8% of measured VOCs (46mg/h). 18 class periods with 27 to 67 students and an average class size of 53 students were evaluated. Fresh air ventilation was held constant at 1970cfm for all experiments.
Analysis of Tang, et al’s experimental data indicates that students elevated classroom VOCs by 44ppb, followed by 27ppb of VOCs brought in with “fresh air” ventilation, and 6ppb contributed by non-student VOC sources in the classroom (furnishings, cleansers, miscellaneous debris) for a total of 77ppb. Formaldehyde is not among detected human VOC emissions. In addition, formaldehyde was not detected in either outdoor air or indoor non-human VOC emissions.
Assuming a human metabolic rate of 0.7 (similar to sleeping, as many students do in college lectures), an average student body weight of 150 pounds per student (guesstimate), 53 students per class, and the classroom’s measured ventilation air flow (1970cfm), we find an average classroom CO2 level of 550ppm in line with the experiment’s results.
We will return to Tang, et al’s classroom experiment with examples that demonstrate how Build Equinox IAQ Standard coupled with smart ventilation incorporating CO2 and VOC control combines to save ventilation energy while automatically maintaining a healthy classroom environment.
Other VOC Emission Sources

High Occupant Density Situations – Classrooms:
Non-human sources of VOCs are important to include when determining VOC concentrations in an indoor space. Ventilation and infiltration air from the outside ambient contribute VOCs to a building’s interior, and VOCs emitted by non-human sources within the indoor space increase VOC concentrations. The two sources must be treated differently. Outdoor VOCs elevate an indoor space’s VOC concentration by a level equal to the outdoor ambient VOC concentration level, similar to outdoor ambient average CO2 concentration elevating indoor CO2 concentration by 400ppm. Non-human, indoor VOC emission sources, similar to human VOC emissions, are diluted as ventilation and infiltration air flows increase.
Tang, et al found an indoor VOC emission rate of 46mg/h and an outdoor VOC contribution of 203mg/h flowing into the classroom with ventilation air. Both contributions are important for determination of total VOC loading and VOC concentration in the classroom space. Relative to the classroom ventilation air flow (1970cfm), the indoor VOC emission source added 6ppb to the VOC concentration while ventilation air increased indoor VOC concentration by 27ppb. If ventilation air flow is decreased by 50%, the indoor VOC source would elevate classroom VOC concentration by 12ppb, while the outdoor contribution to VOC concentration stays constant at 27ppb. The 50% decrease of ventilation air would also double student VOC concentration contribution to 88ppb for a total classroom VOC concentration of 127ppb. We will keep this in mind as we consider how to apply Build Equinox IAQ Standard for sizing ventilation systems.

Low Occupant Density Situations – Residences:
A California study (“Indoor air quality in 24 California residences designed as high-performance homes”, B Less, N Mullen, B Singer, and I Walker, Science and Technology for the Built Environment (2015) 21, 14–24) found average formaldehyde concentrations of 20µg/m3 (16ppb) indoors and 4µg/m3 (3ppb) outdoors for 24 recently renovated homes in the Berkeley CA area. The homes averaged 2100sqft with average normal ACH (air changes per hour) of 0.3/h for an estimated average ventilation and infiltration air flow of 84cfm assuming a ceiling height of 8ft. Total indoor VOC concentrations were not reported for the homes, however, our focus is on formaldehyde as it is a non-human indoor and outdoor source of VOC pollution.
Applying a mass balance to formaldehyde indoor and outdoor concentration levels relative to ventilation and infiltration air flow, we find an average emission rate of 4.1mg/h of formaldehyde inside the California homes. ASHRAE 62.1 ventilation standards and California OEHHA disagree on acceptable, long term formaldehyde exposure levels. California’s current REL (Reference Level Exposure) for formaldehyde is 9µg/m3 (7ppb) while ASHRAE 62.1 lists 35µg/m3 (28ppb).
Interestingly, ASHRAE 62.1-2022 references California’s older 2004 REL standard as its reference. If that leaves you confused and perhaps less trusting of today’s ventilation standards, that’s just fine, because they are confusing. The important thing to know is that we can do something about it: purchase formaldehyde-free materials! More about this in the next section. The important point here is our estimate of 4.1mg/h of formaldehyde inside typically constructed homes, and its impact on a home’s VOC level and required ventilation.
A study by Francisco and co-authors examined IAQ before and after weatherization of 71 homes in Illinois and Indiana (“Ventilation, indoor air quality, and health in homes undergoing weatherization”, P. W. Francisco, D. E. Jacobs, L. Targos, S. L. Dixon, J. Breysse, W. Rose, S. Cali, Indoor Air 2017; 27: 463–477). Roughly half of the homes were sealed to a level based on ASHRAE 62-1989 infiltration ventilation. The other group of homes used mechanical ventilation in addition to infiltration to meet the higher ventilation requirements of ASHRAE 62.2-2010.
Focusing on the 37 homes weatherized, sealed and adjusted to ASHRAE 62.2-2010 ventilation levels, Francisco, et al reports a change from 41cfm (pre-weatherization, infiltration only ventilation) to 79cfm (post-weatherization with mechanical ventilation providing an average 60cfm to the reduced infiltration). CO2 levels decreased from 936ppm to 787ppm from pre- to post-weatherization conditions. Total VOCs dropped from 204ppb to 142ppb, with formaldehyde decreasing from 26ppb to 21ppb. These homes had a total of 37 adults and 52 children for a total of 89 home occupants (2.4 occupants per homes, similar to average US home occupancy).
Francisco, et al reported home occupant health survey information before and after weatherization. Weatherization activities included repairing moisture problems such as condensation leaks, pipe sweating, and other sources of moisture that create mold and other dampness-related health issues in addition to improved ventilation.
Reductions in children health problems included: headaches (31%), hay fever (5%), respiratory allergy (8%), eczema/skin allergy (13%), and asthma (2%). Reductions in adult health problems included: sinusitis (12%), hay fever (8%), chronic bronchitis (8%), and needing help handling routine needs (11%). The significant drops in several categories are indicative of the power of improved ventilation. We note that these homes have natural gas heat and cooking appliances. Elimination of indoor gas combustion products from indoor air would further reduce indoor VOC concentrations and improve health issues such as asthma.
Regarding formaldehyde contributions to indoor VOC concentrations, similar mass balance analyses as described for the California homes estimates 4.1mg/h of formaldehyde emissions for pre-weatherization and 6.3mg/h of formaldehyde emissions for post-weatherization. As commented by Francisco, et al, the authors had no control over weatherization material selections, resulting in formaldehyde infused weatherization materials (eg, OSB, oriented strand board). Fortunately, improved ventilation in the homes counteracted the 50% increased formaldehyde emission rate.
Unfortunately, many weatherization projects are occurring today without ventilation improvements. If ventilation was not enhanced in these homes, reduced infiltration-based ventilation would only be 20cfm, or 25% of the 79cfm enhanced ventilation level. Formaldehyde concentrations would be quadrupled to 80ppb, far exceeding acute formaldehyde levels (45ppb).
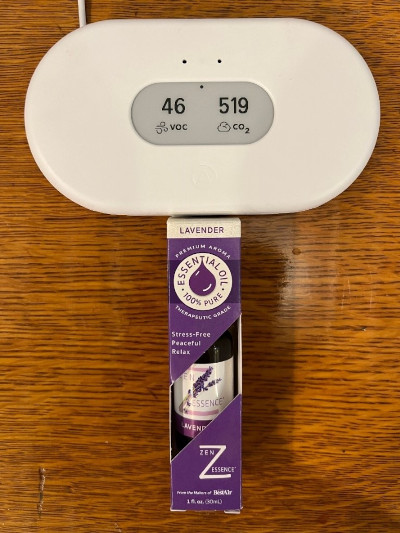
Other non-human VOC emissions can be handled in a similar manner. VOC emission rates can be converted to VOC concentrations levels, and added together with other VOC emissions. Formaldehyde is perhaps the most concerning non-human VOC source due to its abundance in today’s products. Other VOC sources such as fragrances, essential oils (see Figure 1), cleansers, personal care products, solvents, glues, paints, and many other chemicals may also be important, however many of these can be altered as one observes how VOC concentrations in their indoor spaces are impacted.
Additional VOC Considerations
In last month’s article on carbon dioxide (CO2) concentration, we stated that we do not know whether CO2 at low concentrations has a direct impact on our health or is primarily a surrogate indicator of air quality. CO2 produced from human respiration and from indoor combustion (eg, gas cooking) is strongly correlated to VOCs and particulates produced by humans and their activities.
CO2 monitoring is not a substitute for VOC management! Both CO2 and VOCs must be monitored for effective indoor pollutant management. Either CO2 or VOCs (or particulates) will periodically dominate air quality. When CO2 and VOCs are both dominated by human emissions, we expect to find CO2 < 800ppm and total VOCs < 125ppb when adequate fresh air is delivered to an indoor space. An investigation of non-human VOC sources should be conducted when indoor VOC concentrations are significantly greater than expected from human emissions. If VOC concentrations stay elevated while CO2 drops during occupant absence periods, something other than human and human activity are elevating VOCs, such as off gassing of furnishings (eg, formaldehyde emission), an open container of volatile chemicals (paint, cleansers, solvents), air fragrances, etc.

Gas cooking produces CO2 at a greater rate than VOCs in relation to human CO2/VOC emissions. Unfortunately, gas cooking elevates both CO2 and VOCs significantly, with a single stove burner releasing as much CO2 as five humans. Cooking style (eg, frying versus a simmering stew) impacts pollutant emissions, and may increase VOCs emissions relative to CO2. In all electric homes, VOCs from cooking are produced with no CO2 production. An effective kitchen ventilation system will manage VOCs and prevent infusion of cooking odors into a home’s furnishings.
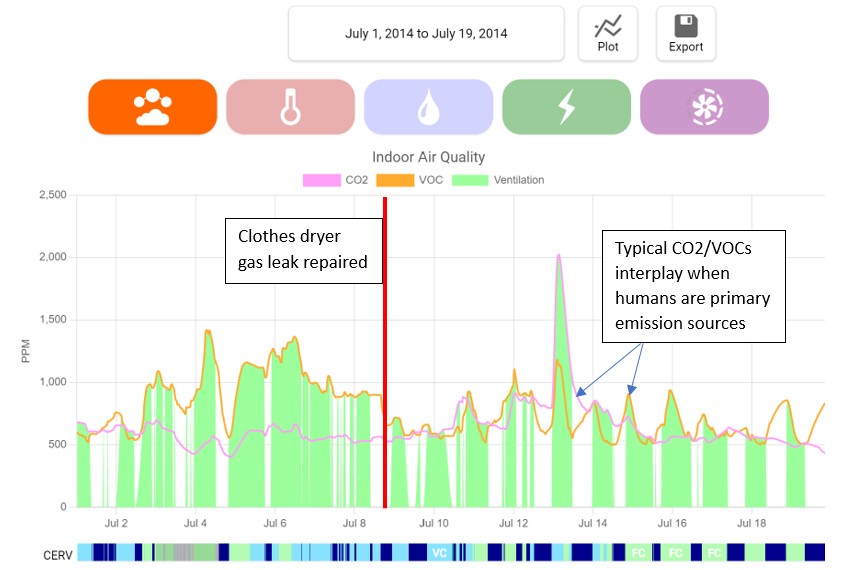
Natural gas and propane are reactive VOCs, readily detected by CERV and CERV2 VOC sensors. CERV/CERV2 units have detected gas leaks from leaky gas appliances. Figure 2 shows data from CERV-ICE (CERV/CERV2 online dashboard) for a new home with a leaky gas clothes dryer fitting. Fortunately, CERV and CERV2 units automatically switch to fresh air ventilation, as seen by the extended ventilation (green shading) period in Figure 2, as gas concentrations increased, helping to keep the natural gas diluted. VOC sensors detect gas concentrations well below odor detection levels, requiring plumbers, HVAC installers, and appliance installers to use electronic “snoopers” to find leaky fittings and faulty appliance components.
In another example, elevated VOCs in a home renovation project were tracked to the CERV unit’s fresh air inlet. The inlet was installed above contaminated soil where a fuel oil tank had been removed. Indoor VOCs increased in the home whenever the CERV operated in fresh air mode, indicating an outdoor source of pollutants. Relocation of the CERV2’s fresh air inlet away from the fuel oil contaminated soil resolved the problem. Without VOC sensing, home occupants would never have known they were bringing polluted air into their home. CO2 sensors are blind to VOCs and no one in the home could “smell” the contaminated air, but it was contaminated!
Some of our early CERV units were installed in Vermod’s first four production homes constructed in 2013 (scroll down Vermod’s homepage and watch “John and Anne’s Story” to see what a difference a decent home can make in someone’s life). During shakedown testing at Vermod’s White River Junction facility, air quality was identical in three homes while the fourth continually exhibited high VOCs, resulting in excess fresh air venting.
If the four unoccupied homes were built with identical materials and processes, why would the CERV unit in one home continually indicate high VOC levels? CERV units were new to the market in 2013, although we had units operating in the field since 2010. Suspicion revolved around the CERV unit and our new VOC sensing technology. Is this new technology reliable? Can we trust it?
Our online monitoring capability allowed us to see that the VOC sensor seemed to be working properly. Indoor VOCs would drop in the problem home during fresh air ventilation as expected. VOCs in the problem home would inexplicably climb during recirculation mode while VOCs in the other 3 homes stayed low.
Someone finally remembered that one of the four formaldehyde-free, Formica countertops was damaged during delivery. The replacement countertop was supposed to be formaldehyde free, but was not! The CERV’s VOC sensor was correct after all. There was no odor nor observable difference among the countertops. Replacing the offending countertop with a formaldehyde free countertop made the difference….an important difference that would not have been determined without VOC sensing!
Making Smart CO2 and VOC Control Real – Residence and Classroom IAQ Examples
Two examples, one for a home and another for a classroom demonstrate how Build Equinox IAQ Standard coupled with smart ventilation as implemented by CERV ventilation systems maintains healthy air and simultaneously excels in energy efficiency in comparison to today’s inefficient, constant ventilation flow systems.
Residence Ventilation Example (low occupant density situation):
Assume we have a new, all-electric 2500sqft home, sealed to 1ACH50 with 4 bedrooms and 3 occupants. The occupants are home for 2/3 of the day (16 hours). According to ASHRAE 62.2-2022, the home requires 113cfm of continuous ventilation. Infiltration adds an average of 17cfm to the mechanical ventilation system for a constant air flow of 130cfm. It is important to note that sometimes infiltration adds no additional air flow, and other times it adds quite a bit, depending on wind speed and indoor/outdoor temperature difference.
As an alternative to constant flow ventilation, implementing CERV2 smart ventilation with CO2 and VOC air quality control, the homeowner sets the CERV2 CO2 setpoint to 800ppm and VOC setpoint to 125ppb (note, we have scaled VOC setpoints to human CO2 on the CERV2 controls, so a setting of 800ppm for VOCs is also used, indicating a VOC level of 125ppb). We neglect transient effects, but the interested reader should review our Smart Ventilation report and Smart Air Distribution report in which a sophisticated, 5 minute time stepping simulation model with real weather data compares annual air quality and energy performance of constant flow ventilation (ASHRAE 62.2) and smart ventilation (CERV/CERV2) operation.
We assume the occupants have an average 1Met activity level (8 hours of sleep with 0.7Met, and 8 hours of activity with 1.3Met) during their 16 hours in the home. Assuming the average weight of the home occupants to be 150 pounds, we can determine that the home’s required air flow for maintaining 800ppm CO2 during house occupancy is 62cfm. Infiltration provides 17cfm as discussed previously, for a smart ventilation air flow rate of 45cfm during occupancy. The house is occupied for 2/3 of a day, for a daily average of 30cfm of fresh air flow, resulting in a fresh air ventilation flow that is less than 25% of ASHRAE constant flow ventilation. And that saves a lot of energy!
Before discussing how CERV2 smart ventilation also maintains better air quality than the higher, constant air flow ventilation systems, let’s consider VOC ventilation needs. As we previously discussed, a reasonable human VOC emission rate is 6250µg/h-person. If we assume the homeowners did an excellent job selecting no/low VOC materials for their home and have negligible non-human VOC sources, and that outdoor air has negligible VOCs, the ventilation rate required to maintain indoor VOCs below 125ppb would be 40cfm. In comparison to fresh air ventilation for managing CO2, we see that it dominates over VOCs, requiring 62cfm (with 45cfm from the smart ventilation system and 17cfm from infiltration).
Ventilation needs can change significantly from house-to-house. If a formaldehyde infused material (eg, flooring) with 10mg/h of formaldehyde emissions was substituted into the home’s construction, coupled with cooking VOCs released at 15mg/h, we would find VOC ventilation needs increase to 92cfm, greater than 62cfm required to maintain CO2 at 800ppm. Note that continuous off gassing by furnishings require some level of fresh air ventilation as VOCs continual build up during unoccupied periods while no/low VOC furnishings do not require any ventilation to keep VOCs in control.
We finish up this example by discussing how smart ventilation also provides better IAQ control than constant flow, one-and-done ventilation. One might think the much higher flow, constant ventilation system also has better IAQ than the much lower ventilation flow of the smart system, but that is not the case. The constant flow ventilation system is very, very inefficient in using fresh air to benefit the home’s occupants.
Imagine the house has 8 fresh air zones (4 bedrooms, family room, fitness room, dining room, kitchen, den), and that fresh air is evenly divided among these rooms. Fresh air delivered to each room works its way to nearby exhaust return ducts, such as in bathrooms, mudroom, kitchen, and laundry. We will assume that infiltration is evenly added to the fresh air supply, but that is never the case in reality….where infiltration occurs and where you live are generally two different places.
The constant flow ventilation system’s 130cfm is divided into 8 ducts delivering 16cfm to each of the 8 zones. Let’s assume all three occupants are in the den, which increases in CO2 to 2000 to 3000ppm within a fairly short time. VOCs increase to over 300ppb due to human VOC emissions. 114cfm, or 88% of the constant ventilation fresh air flow delivered to unoccupied rooms flows to the nearest exhaust register without ever benefiting a human in the house.
The CERV2 smart ventilation system operates in a much different manner. Although it may only be adding 45cfm of fresh air into the house during occupied periods, it typically operates at 200cfm. More than 80% of the time the CERV2 is operating in recirculation mode, which allows the CERV2 to move fresh air “stored” in the home’s unoccupied areas to the occupied areas. Fresh air is never wasted! Recirculation mode is essential in all homes because it is needed for removing indoor particulates generated indoors by occupants and our activities. In one-and-done ventilation systems without recirculation, particulates and contagions build up to unhealthy levels. As homes become larger and more complex (more rooms and zones), adding zone dampers and wireless occupancy and IAQ sensors can trigger the CERV2 to open and close fresh air supply and exhaust dampers in order to deliver fresh air and remove polluted air where the need is greatest.

Classroom Ventilation Example (high occupant density situation):
We return to Tang, et al’s classroom situation relative to its operation and Build Equinox’s IAQ Standard’s CO2 and VOC recommended levels. The classroom at UC Berkeley is typical of many classrooms with constant ventilation flow. More commercial spaces are adding CO2 to ventilation systems, however CO2 alone will be unable to detect unhealthy VOC conditions.
The classroom’s 1970cfm fresh air ventilation resulted in 550ppm CO2 and 77ppb VOCs with 53 students in the room. Converting the ventilation system to a variable speed fan and modulating its speed to meet Build Equinox’s IAQ Standard will deliver significant fan energy and comfort conditioning energy savings while keeping classroom occupants healthy. During low/no occupancy periods, the ventilation system would turn down to very low flow, sufficient for assessing room IAQ comfort conditions, addressing variations in IAQ and comfort as needed.
For the classroom to maintain VOCs at 125ppb with 53 students with Tang, et al’s outdoor and indoor emission levels, 1012cfm of air flow is required. To maintain the classroom at 800ppm CO2 requires 770cfm of fresh air. In this case, VOCs dominate ventilation air flow rate requirements. Note that if outdoor VOC concentration was negligible instead of the urban environment’s 27ppb outdoor VOCs, fresh air ventilation would drop to 795cfm, similar to CO2 ventilation needs.
The smallest class had 26 students, which requires 560cfm to maintain VOCs at 125ppb, and 380cfm to manage CO2 at 800ppm. The largest class with 67 students requires 1250cfm to maintain 125ppb VOC concentration and 970cfm to maintain 800ppm CO2 concentration. Without outdoor VOCs and no non-human VOC emissions in the classroom, 340cfm would be needed for the small class and 880cfm is needed for the large class to maintain 125ppb VOC concentration.
Summary
VOCs are important to control in our indoor environments. Build Equinox has formulated its healthy IAQ Standard based on human pollutant emissions. All indoor occupied spaces will become polluted due to pollutant emissions by its occupants. Ideally, human occupants are the primary, if not the only source of pollutant emissions. When humans are the dominant source of pollutant emissions, our IAQ Standard predicts similar ventilation levels for maintaining CO2 and VOCs at healthy levels.
When other sources add to human pollutant emissions, our IAQ Standard provides a straightforward path for determining how much ventilation is needed to keep CO2 and VOC pollutants within a heathy range. Whichever pollutant has the higher ventilation air flow requirement is the ventilation level that should be used.
Active, smart control of ventilation with CO2 and VOC sensors does not waste fresh air as in constant flow, one-and-done systems. Smart ventilation more effectively maintains excellent indoor air quality as well as much more energy efficient. Applying smart ventilation to all indoor environments will form a protective cover significantly decreases the spread of contagions, reduces sick days and absenteeism, increases productivity and sleep quality, and provides enormous economic benefits to all income levels and age groups.
Build Equinox IAQ Standard is based on health in contrast to today’s “edge of sickness” ventilation standards. The gap between our healthy air quality standard and today’s ventilation standards is significant. The energy cost difference for healthy air is less than 2 cents per hour per person in harsh climates without energy recovery. Isn’t your health and the health of people around you worth 2 cents per hour? We know it is!
Related Articles
newspaperHealthy Indoor Air Quality Standards: Carbon Dioxide (CO2)
newspaperHealthy Indoor Air Quality Standards: Particulates (PC0.3 and PM10)
newspaperHealthy Indoor Air Quality Standards: Carbon Monoxide and Radon