


The CERV stands out for its people-centric approach to indoor air quality management, leveraging advanced sensors to monitor CO2 and VOC levels in real-time. These sensors serve as the backbone of the system, constantly assessing air quality conditions within the home environment. When CO2 or VOC levels rise above user-defined thresholds, indicating a decline in indoor air quality, the CERV springs into action, initiating ventilation to expel pollutants and introduce fresh outdoor air.
What sets the CERV apart from other systems is its ability to strike a balance between maintaining optimal air quality and conserving energy. Rather than running continuously at maximum (or minimum) ventilation rates, the CERV intelligently adjusts its operation based on actual air quality conditions. During periods when pollutant levels are within acceptable ranges, the system scales back ventilation, saving energy without compromising indoor air quality.
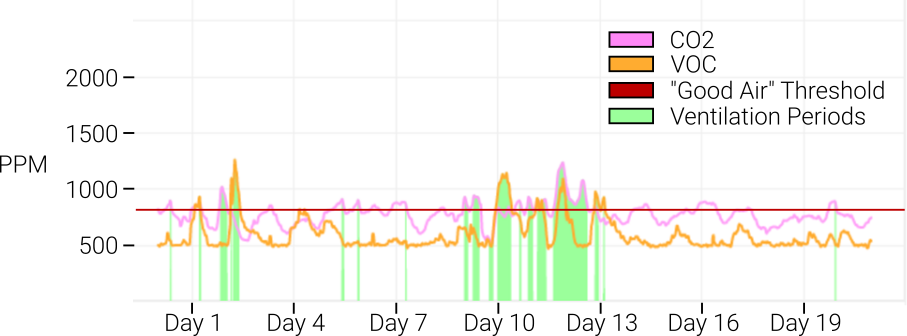
Indoor Air Quality for a 3 week period with an ERV
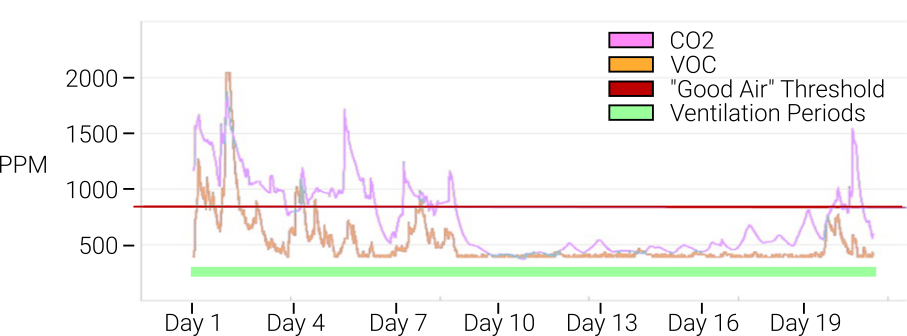
Indoor Air Quality for a 3 week period with the CERV
Crucially, the CERV puts control in the hands of occupants, allowing them to fine-tune ventilation preferences according to their needs. By enabling users to specify their desired CO2 and VOC thresholds, the system offers a level of customization that aligns with individual comfort levels. This feature ensures that occupants can enjoy a healthy indoor environment while also optimizing energy usage to suit their lifestyle.
In essence, the Build Equinox CERV represents a paradigm shift in indoor air quality management, offering a holistic approach that prioritizes both occupant health and energy efficiency. By harnessing the power of advanced sensors and user-defined settings, the CERV ensures that homes remain fresh and healthy environments for occupants to thrive, all while minimizing energy consumption.
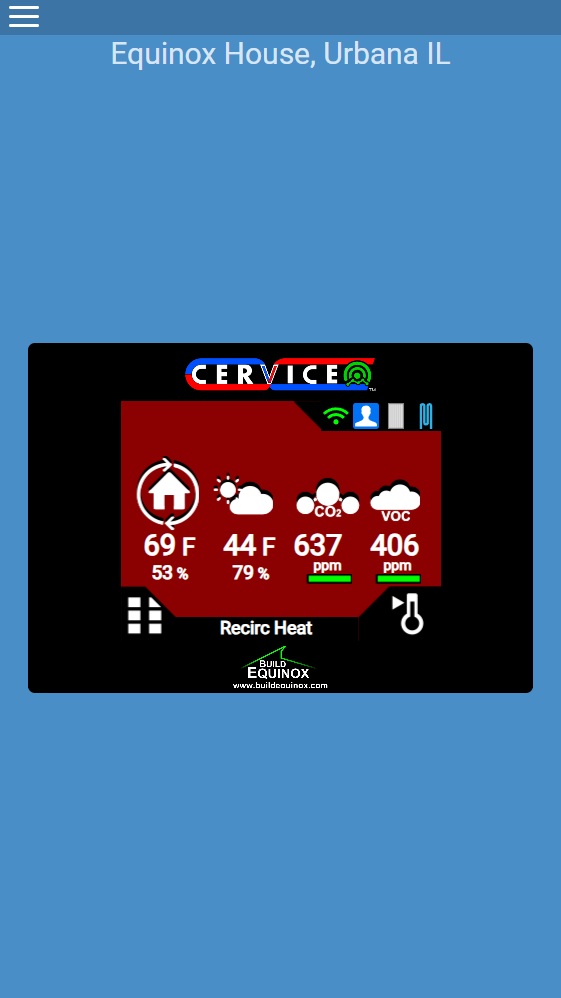
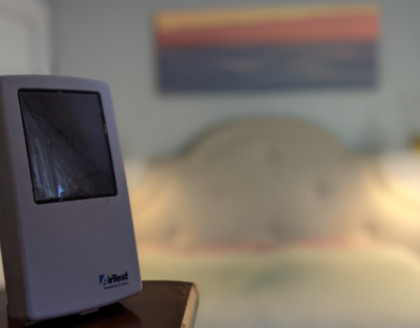
When the CERV is integrated with the CERV-ICE app, users gain unprecedented visibility into their indoor air quality. Through this online interface, occupants can effortlessly monitor real-time CO2 and VOC levels from their smartphones, tablets or computers, providing invaluable insights into the health of their indoor environment. With just a few taps, users can access comprehensive data on air quality trends, allowing them to identify patterns and potential areas for improvement.
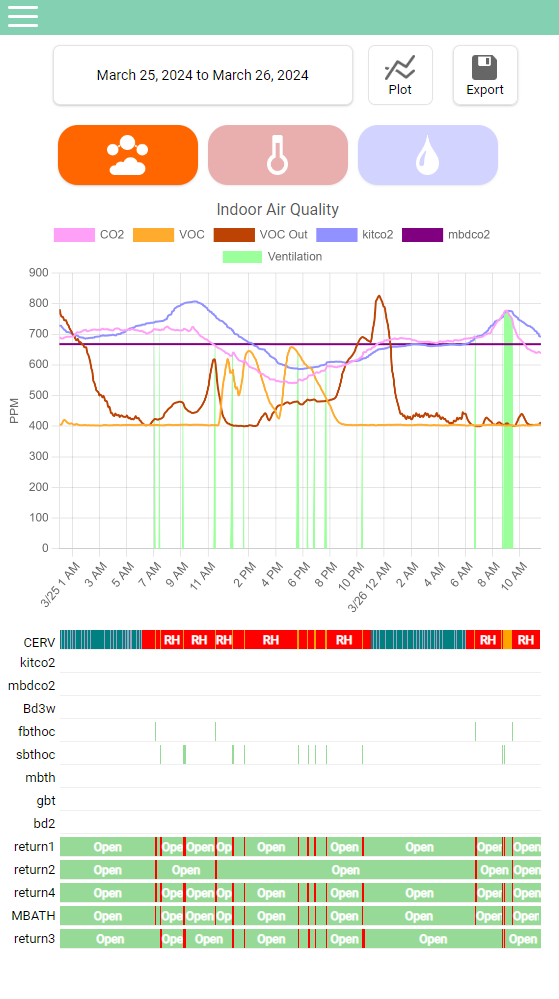
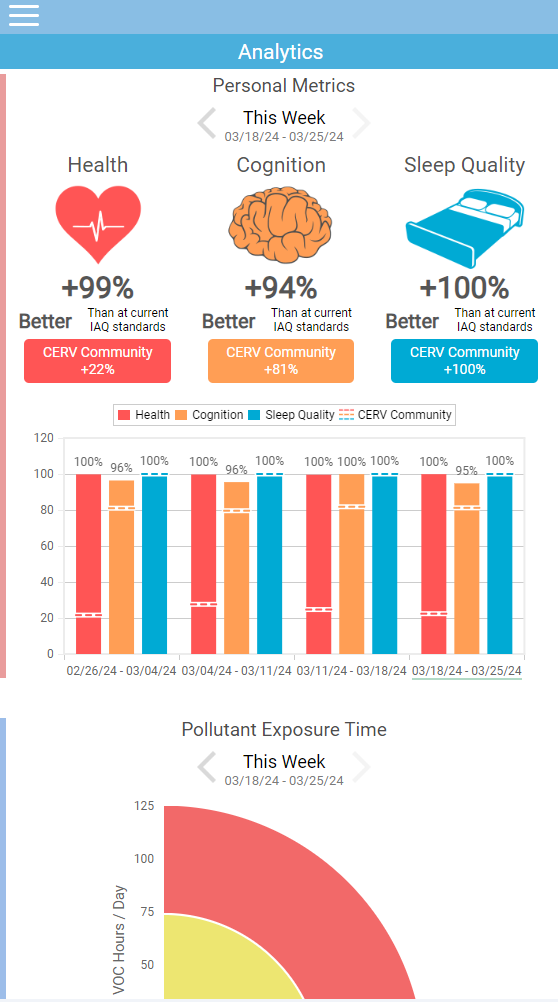
The CERV-ICE app also offers the added benefit of historical data analysis, enabling users to track changes in indoor air quality over time. By reviewing past data, occupants can gain a deeper understanding of their home’s air quality dynamics, pinpointing specific events or activities that may have influenced air quality levels. Armed with this knowledge, users can make informed decisions to optimize their ventilation settings and further enhance indoor air quality for the long term. Ultimately, the seamless integration of the CERV with the CERV-ICE app empowers users to take control of their indoor environment like never before, ensuring a healthier and more comfortable living space.
Related Articles
newspaperHealthy Indoor Air Quality Standards: Carbon Dioxide (CO2)
newspaperHealthy Indoor Air Quality Standards: Volatile Organic Compounds (VOCs)
newspaperHealthy Indoor Air Quality Standards: Particulates (PC0.3 and PM10)
newspaperHealthy Indoor Air Quality Standards: Carbon Monoxide & Radon