

Cost Optimization of Ventilation Ducts
How much should a ventilation system’s ductwork cost? And, how can one determine if an installed duct network performs at an acceptable level? We begin a new topic, “Ductology” with a two-part series that explores these questions.
Ductwork in residences should receive at least as much design attention as walls, roofs and kitchen cabinets. The energy cost associated with ventilation fan operation can easily exceed the energy cost of heat passing through a house’s walls. Unfortunately, duct design is often left as an afterthought. Duct design is complicated and takes time. But, improperly designed ventilation systems last the lifetime of a home, causing a lifetime of excessive cost and worse, poor health.
In part 1, we will focus on ventilation system cost and performance. Part 2 will discuss assessing the performance of installed duct systems. For those interested in duct design methods, such as Manual D or ASHRAE procedures, we recommend The Energy Vanguard’s 4-part series on duct design as a good place to begin.
Duct Economics
Optimizing the size of ventilation ductwork is analogous to optimizing wall insulation thickness. A “Life Cycle Cost” (LCC) relation is formulated that totals energy cost and installation cost. The combination of energy cost and installation cost that minimizes the LCC is the most economical system.
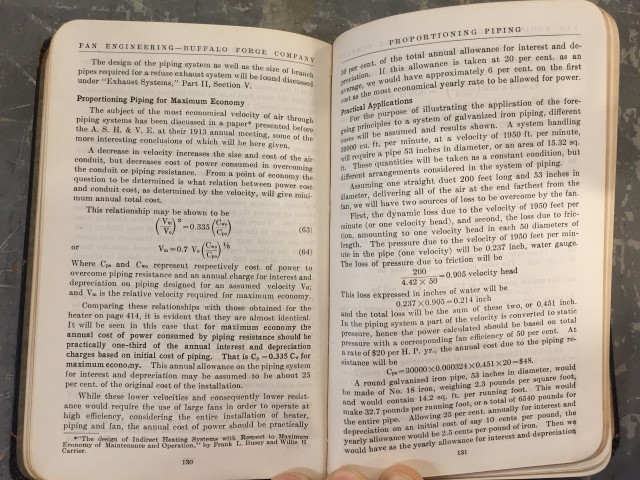
Engineers have been economically optimizing ventilation systems for more than 100 years, as seen in this page from a 1914 edition of Fan Engineering. Interestingly, after accounting for a 25-fold increase in the dollar (one 1914 dollar ~ twenty five 2017 dollars), the economics and resulting duct sizes are not too different. And the cardinal rule of residential duct flow…keep duct air velocities below 700fpm…was the same in 1914 as it is today.
Figure 1 shows the Life Cycle Cost (LCC) of 100ft long duct systems with 150cfm, 200cfm and 300cfm of airflow. Details of the LCC relation are in the Appendix, but basically, the LCC is the addition of fan power cost over the lifetime of the ventilation system (100 years assumed) and the installation cost (details of duct installation cost are included in the Appendix).
The minimum LCC value for each airflow has been marked on Figure 1. At 150cfm, a 9 inch diameter duct would be most economical. At 200cfm and 300cfm, the most economical duct systems would have 10 inch and 12 inch diameter ducts, respectively. An interesting characteristic of the optimal duct diameter is that it is not dependent on duct length. Although duct installation cost and duct operation (energy) cost are both directly affected by duct length, optimal duct diameter is independent of the duct length!
The two LCC relation factors, duct installation cost and lifetime energy cost, work in opposition to each other. On the left side of the optimum duct diameter in Figure 1, the increase in LCC is due to rapidly increasing energy cost because the required fan power rapidly escalates with decreased duct diameter. On the right side of the optimum duct diameter, increasing LCC is due to the modest escalation of installation cost of larger diameter duct.
If the ventilation system installer decided to scrimp on duct size, or insufficient duct clearance forced a smaller duct than optimal to be installed, the economic and energy cost penalties climb more rapidly. A 6 inch duct would increase LCC by more than $2000 with a 50cfm increase from 150cfm to 200cfm, while a desired increase from 150cfm to 300cfm would increase LCC by $7000!
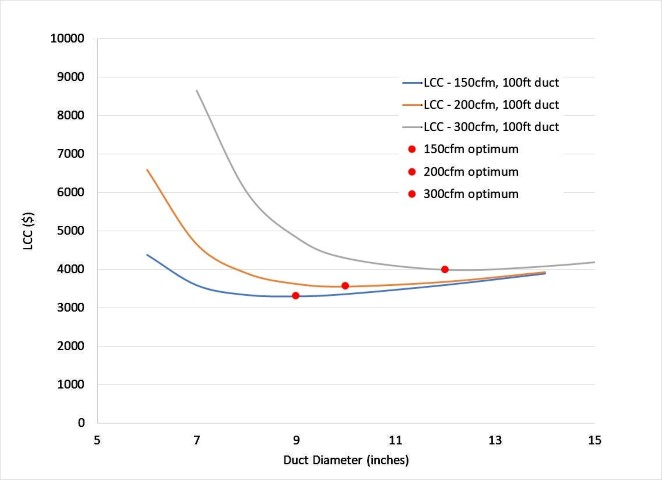
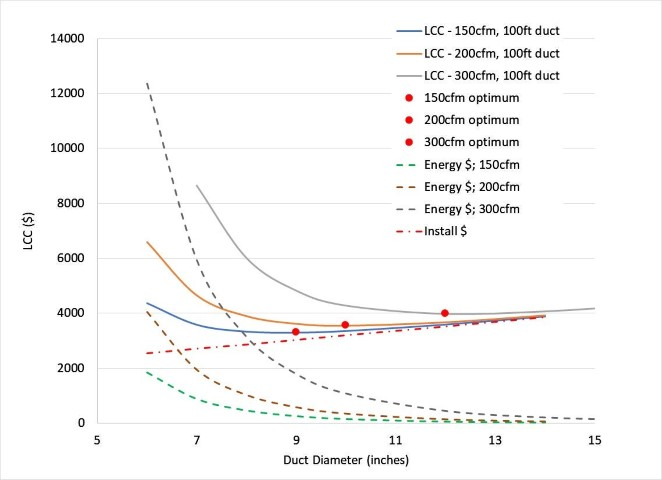
Figure 2 is the same plot as Figure 1 showing the LCC versus duct diameter with additional details showing the lifetime energy cost and duct installation cost. Lifetime energy cost for fan operation increases very rapidly as duct diameter is reduced. Why? Fan power is inversely related to duct diameter raised to approximately the fifth power (actually, 4.75 power)! Heat flow through wall insulation is only inversely related to insulation thickness. A change of wall insulation thickness from 12inches to 10inches causes a 20% increase in heat flow (12/10). Reduction of duct diameter from 12inches to 10inches causes a (12/10)5 or 150% increase in fan power! And, it is important to remember that “heat” (more properly, “thermal energy”) is less valuable than a fan’s electrical energy.
A single relation for determining the optimal duct diameter can be derived, which eliminates the necessity of evaluation a range of LCC operational costs and duct installation cost. The appendix contains the expression for the most economical duct diameter. Figure 3 shows optimal duct diameter trends over a range of air flow rates. The duct is assumed to have a 100 year lifetime and to have a 20% efficient fan-motor attached. The installation cost for duct uses a cost model described in the appendix. The appendix model assumes fixed cost per foot of installed duct plus a diameter related cost term. These two terms can be changed relative to one’s local duct installation costs. Some guidance for determining local duct installation cost factors based on quotes is included in the appendix. Also plotted on Figure 3 is air velocity (relation included in appendix). As previously mentioned, keeping residential duct velocities below 700feet per minute (fpm) is recommended. For flow ranges of most interest for residential ventilation systems, the optimal duct diameter will result in duct velocities below 700fpm.
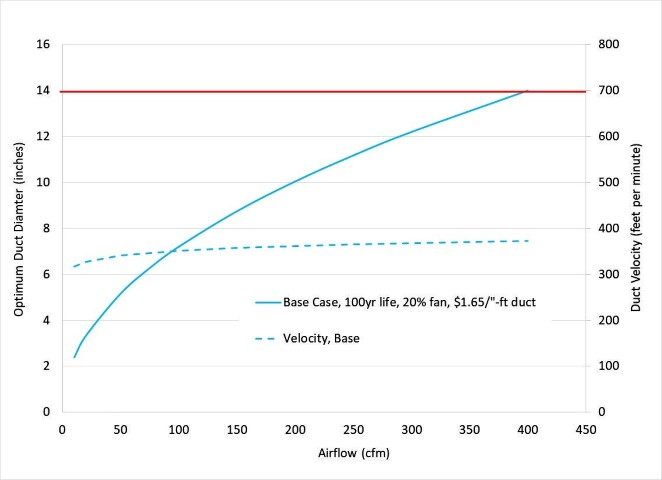
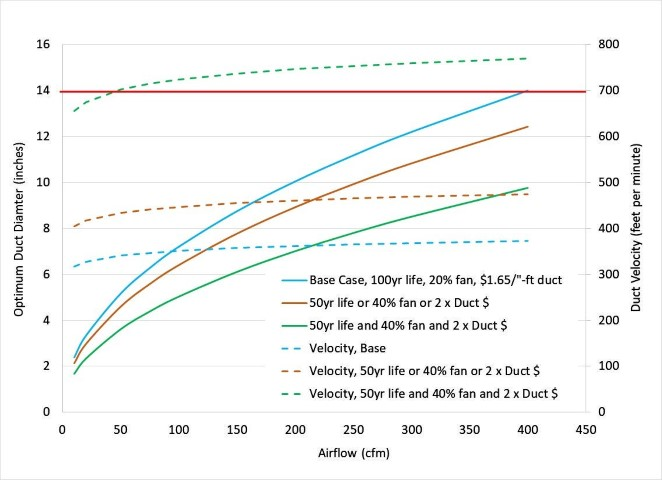
Figure 4 shows the same plot as figure 3 with some additional curves showing the impact of variations of duct lifetime, fan efficiency and installation cost. Optimum duct diameter will be reduced when the cost of energy (eg, improved fan efficiency or decreased ventilation lifetime) decreases or the cost of the duct (eg, increased duct installation cost) increases.
The Life Cycle Cost relation is proportional to changes in duct lifetime, duct installation cost and fan-motor efficiency. Doubling the cost of duct installation, doubling fan efficiency, or halving the duct lifetime all have the same impact on the optimum duct diameter. At 300cfm, the optimum duct diameter would be reduced from 12 inches to 10-11 inches in diameter if ventilation energy cost is decreased in half or the cost of duct is doubled. Note that the associated duct velocity plots included in figure 4 shows an increase from 350fpm to 450fpm at 300cfm air flow, which is below the 700fpm upper velocity recommendation.
Figure 4 shows the combined impact of more expensive duct installation with doubling of fan efficiency and decreased duct system lifetime. The combined impact of this 8-fold increase of duct cost relative to fan energy cost results in an optimum duct diameter decrease from 12 inches to 8-9 inches in diameter. This rather modest decrease in optimum duct diameter is due to the rapid rise of lifetime fan energy cost at small duct diameters. Note that air velocity for the case of 8-fold increase in duct cost to energy cost has now exceeded 700fpm. One should increase duct size to keep velocity below 700fpm in order reduce the potential for duct noise generation and transmission. Today’s high performance homes are much quieter than yesteryear’s poorly insulated and leaky homes, making duct noise transmission more of a concern.
Multi-Branch Duct Systems Cost:
The optimal duct size can be applied to any section of duct. Main duct trunk and branches are optimized individually. Note that we are not replacing the need to formally work through a duct design process such as Manual D which includes the impact of filters, grills, elbows, tees, etc. Our goal is to provide a means for determining the cost and economics of a ventilation system.
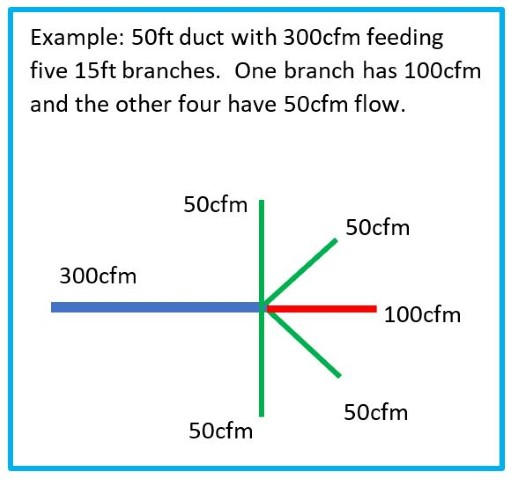
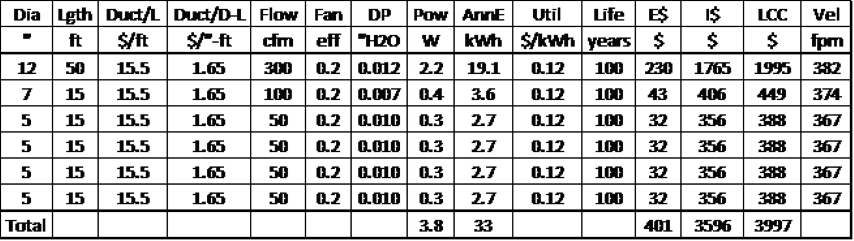
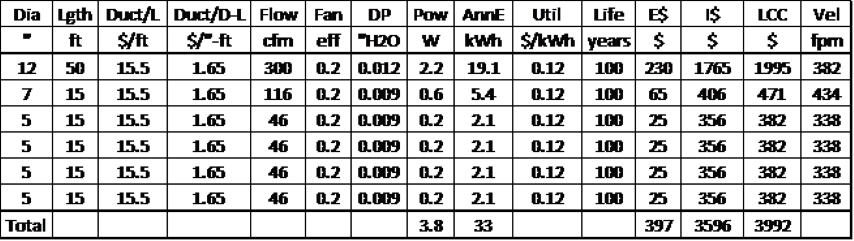
As an example, suppose a duct supply network consists of a central trunk with 300cfm that runs for 50 feet, with five 15ft long branches that separate from the central supply trunk. Four of the branches supply 50cfm while the fifth is designed to supply 100cfm. From Figure 3, we find optimum diameters for the 300cfm, 100cfm and 50cfm duct sections are 12 inches, 7 inches and 5 inches, respectively. Table 1 shows other duct system parameters for this example using relations from the appendix in a spreadsheet.
Assumptions built into Figure 3 include an assumed duct lifetime of 100years, energy cost of $0.12 per kWh, duct installation cost using information in the appendix, and fan efficiency of 20%.
The pressure drop (DP) in each branch must be balanced just as in real duct systems. That is, in Table 1, the 100cfm branch shows a pressure drop of 0.007”H2O while the 50cfm branches show a pressure drop of 0.010” H2O. Nature will equalize the pressure drop of these branches. Equalization of the pressure drop in the branches can be achieved in different manners. Adjustable grills and diffusers can be used to “balance” the branches to desired airflows, coupled with fan speed changes to achieve the overall desired flow rate. We will discuss these techniques in Ductology Part 2 when duct system performance is covered.
For the present example, we will assume that no adjustable grills or diffusers are attached to the branches. Ideally, one would like to have a “naturally” balanced duct system because any pressure increasing adjustment of a duct outlet is an addition of pressure drop, and pressure drop means fan power, and fan power costs energy and money! Table 2 shows the natural balance of the duct system. The 300cfm of the main branch is held constant (but its flow can also vary depending on the fan’s control characteristics). Adjustments are made to the branches until all branches have the same pressure drop (0.009”H2O). All branch airflows must add to the total flow through the main branch. If one finds an equal pressure drop solution for all duct branches that add to something other than 300cfm, the main duct trunk can be adjusted to this flow level. This is the basis for the “equal friction” duct sizing method. Some iteration is required as one works between balancing pressure drops and conserving air mass flow rates.
For this example, the system would naturally balance to a flow of 116cfm in the higher flow branch while the other branches are at 46cfm. In multi-branched, manifolded duct systems, accurately measuring a duct flow within 10cfm is extremely difficult, regardless of the decimal values on today’s bolometer readouts, and, regardless of whether or not the bolometer is powered compensated. Watch for more on measuring airflow in duct manifold systems in future Ductology articles. Notice that the adjusted values in Table 2 do not shift operational cost or LCC values significantly from those in Table 1, and that duct velocities are well within our desired range.
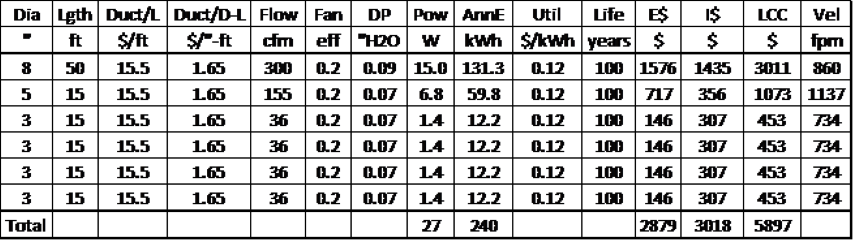
Table 3 is an example of what happens when someone “wings it” or uses “shoot-from-the hip” duct design. Decreasing the main duct branch from 12” to 8” diameter, and other duct branches to 5” (100cfm branch) and 3” (50cfm branch) results in a LCC cost increase of $2000 and fan power increase of 700%! A decrease from 12 inch to 8 inch diameter reduces the flow area to less than half, which doubles the air velocity (see Table 2 and Table 3 velocities). Because pressure drop is related to the kinetic energy of the flow, which is in turn related to the square of the velocity, one finds that the pressure drop has quadrupled! The slight savings in duct installation cost ($600) is more than offset by the cost of the fan power increase. From the perspective overall house cost, the cost of ductwork is a minor cost, especially in relation to the cost of kitchen cabinets and bathroom fixtures. The health cost of poorly designed ventilation, however, can easily exceed the cost of your home.
Small Duct Air Distribution Systems:
Multi-duct systems using small diameter ducts may allow installers more flexibility in terms of clearance space. Additionally, the plug-n-play nature of some small diameter duct systems may reduce duct installation skill, shifting ventilation system installation labor from HVAC professionals to less expensive labor.
We will explore the relative cost of a small diameter, multi-duct system using our previous multi-branch duct system example. We don’t advocate one duct system over another, but we do stress that whatever you choose, be sure that it is designed properly. Although one might find some installation cost savings with small duct systems, pressure drop sensitivity of small diameter ducts can severely limit future ventilation air flow increases.
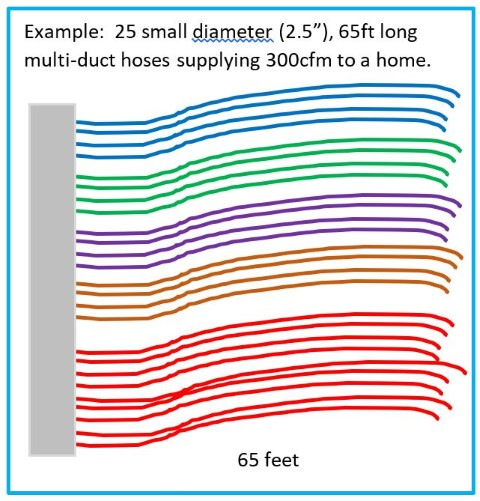
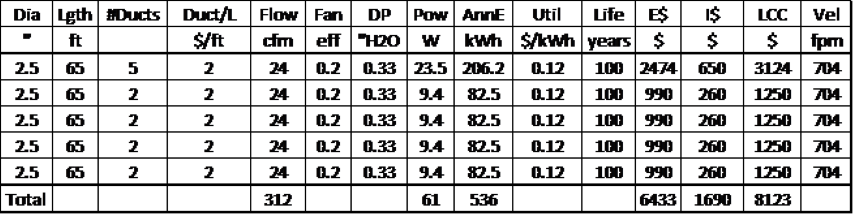
The example schematic shows a duct distribution box (plenum) with 25 lengths (65ft) of small diameter duct for the 300cfm air flow example. Assuming the small diameter duct to have a diameter of 2.5 inches, the optimal air flow for the duct is 12cfm (see Figure 3). Remember, optimal duct diameter is independent of duct length. In order to deliver the equivalent air flow as in the previous example (~300cfm), four sets of four duct hoses are required for delivering 50cfm of air to four rooms in the home, and nine sets of duct hoses are required for delivering 100cfm of air for an approximate airflow total of 300cfm. Whereas the branched system in the previous example assume one 50ft trunk carrying 300cfm to five 15ft long distribution branches, the current example assumes 65ft duct hose lengths emanating from a single distribution box. The schematic is meant to show that this is a lot of spaghetti!
All branches have the same pressure drop if all branches are the same length. Because pressure drop is proportional to length, a ventilation system with one duct twice as long as another will also have a pressure drop that is double. If both ducts require the same airflow, the shorter duct will require some pressure drop increase with a diffuser or grill. Remember, increasing pressure drop increases fan power which increases ventilation system energy cost. Another way to compensate longer versus shorter duct hose runs is to add more duct hoses to the longer run until it has the same pressure drop as the shorter duct length, however, this adds duct installation cost.
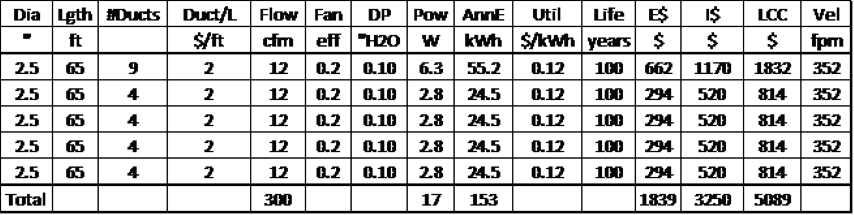
Table 4 shows the results for the optimized small duct hose system. In comparison to Table 2 with pressure balanced (equal duct friction) branches, the small hose duct system would cost $350 less to install ($3250 vs $3600). Note that for the small duct system, the installation cost is assumed to be $2 per foot of length with no diameter related duct cost as in the larger duct installation cost model. Even though both large and small duct systems have optimized diameters, notice that the small duct system has 5 times the pressure drop per hose length as each branch in the large duct system. For the large duct system, the total pressure drop is the sum of the main duct trunk pressure drop (0.012”H2O) and the branch pressure drop (0.009”H2O) as seen in Table 2, while a 65ft long duct hose in the small diameter duct system has a pressure drop of 0.10”H2O (Table 4). The increased pressure drop in the small hose system is caused by the increased duct wall surface area. The small duct system has nearly 1100 square feet of internal duct surface area compared to 260 square feet of inside surface area for the larger duct system, which is an important duct friction factor. Overall, the small duct hose system is $1000 more expensive in Life Cycle Cost due to higher operational cost, due to higher fan power costs that offset potentially lower duct installation cost.
Finally, Table 5 shows how LCC can rapidly escalate with small duct systems if one tries to reduce installation cost by reducing the number of hoses. Reducing the number of hoses in half (note, the 9 hose branch has been reduced to a 5 hose branch) for the same overall air flow rate (~300cfm) increases the LCC by $3000 relative to Table 4 cost due to rapidly escalating fan energy cost. Table 5 LCC cost is double the optimized Table 2 large duct cost.
Conclusion
Duct design is not fun for most people, but properly designed ventilation systems are essential for our health and for our pocketbooks. We hope Part 1 of Ductology has provided some understanding of the principles of economically optimized duct systems, and the trends associated with fan energy and duct installation costs. For sure, costs will be different in different regions of the world, but the fundamental balance of fan energy and duct installation costs are the same. The economic optimum of a duct system is that point where the rate of fan energy decrease is equal to the rate of installed duct cost increase.
Our next newsletter will examine the installed performance of duct systems. Conducting a detailed duct design as discussed in this article is the first step to ensure an economically optimized ventilation system. Ensuring that the installed duct system performs as designed is the second essential step. A simple performance test can be conducted. The results of the test will allow one to ascertain whether the installed system is properly performing. Hopefully, before the system is hidden behind wallboard.
We have avoided incorporating computational relations in the article for clarity, and even with those removed, this article is long (and boring). For those interested in the computational basis for these analyses, the appendix contains all the relations used for the figures and tables. The tables provide results that can be used to verify your calculations. And if you find errors, please let us know!
Appendix – Duct Relations
The results discussed in this article are based on standard duct friction relations. We have massaged these functions into convenient units for residential duct design, which should allow interested users to easily incorporate into a spreadsheet format.
Pressure Drop:
DP = (1.532×10⁻³ x L x Q1.75 )/ D4.75
Where
DP = static pressure drop across duct length (“H2O)
L = duct length (feet)
Q = air flow (cfm, cubic feet per minute)
D = duct diameter (inches)
As an example, an 8 inch diameter duct with 300cfm of air flowing through 100 feet of duct will have a pressure drop of 0.17”H2O. You can verify this result by checking the duct friction chart at the Engineering Toolbox.
Airflow:
If you would like to determine airflow for a given pressure drop, the reciprocal of the previous relation is:
Using the previous example, 100 feet of 8 inch diameter duct with 0.17”H2O pressure drop has 300cfm flow.
Power:
The power required to move air through a length of duct of a specified diameter is equal to the airflow rate times the pressure drop (P = Q x DP). The expression below includes unit conversions and fan efficiency in order to determine the fan power in terms of Watts.
P = 1.8×10⁻⁴ x L x Q2.75 / (η x D4.75)
Where
P = electrical power (Watts)
η = fan-motor efficiency (fraction)
L = duct length (feet)
Q = air flow (cfm, cubic feet per minute)
D = duct diameter (inches)
For fans with airflow less than 400cfm, a good fan-motor efficiency is 0.2 (20%). Recent ASHRAE research indicates that R&D efforts could double small fan-motor efficiencies in the future (“Path to 50+% Efficient Fans For Unitary Applications”, S. Kavanaugh, D. O’Neal, ASHRAE Journal, Dec, 2017).
From the previous example, and assuming a fan-motor efficiency of 0.2, the electrical power required to have 300cfm flow through an 8 inch diameter, 100ft long duct is 30Watts. The impact of reducing duct diameter from 8 inches to 6 inches results in an increase of fan power to 118Watts! In the days of incandescent lighting, 118Watts may not sound large, but in today’s high performance homes, continuous operation of an electrical load with 118W is 1030kWh, or about $125 per year utility cost. Also note how the duct system impacts a fan’s airflow per power (cfm/W) condition. The 8 inch diameter duct results in 10cfm/W compared to a 6 inch diameter duct with 2.5cfm/W, assuming the fan’s efficiency is the same.
Duct Installation Cost:
The following is a model for installed duct cost:
I = ( α x D2 +β x D + γ ) x L
Where
I = duct installation cost per length ($/ft)
D = duct diameter (inches)
L = duct length (ft)
α = duct cost per diameter squared per length ($/ft-in2) ~ 0.0216$/ft-in2
β = duct cost per diameter per length ($/ft-in) ~ 1.65$/ft-in
γ = duct cost per length ($/ft) ~15.5$/ft
For ducts smaller than 12 inches in diameter, the higher order term (α) can be neglected. With the duct installation cost factors assumed above, the relation for duct installation cost is:
I = ( $1.65/ft-in x D + $15.50/ft ) x L
Installation cost for a 100ft long, 8 inch diameter duct would be $2870.
Of course, this duct installation cost relation will be different based on local wage rates and material costs. These factors can be readily determined from quotations received from local contractors. One should request at installation costs for two different duct diameters. For example, suppose a home will have 75ft of duct length, and the installation quote for 8 inch diameter duct is $2500 and the quote for 10 inch diameter duct is $3000.
The β factor for duct installation would be determined as:
β = ($3000 – $2500)/((10in – 8in)x75ft) = $3.33/ft-in
and the γ factor would be:
γ = ($3000/75ft) – ($3.33/ft-in) x 10in = $6.7/ft
The β factor is important for determining the optimal duct diameter, discussed later.
Lifetime Energy Cost:
The lifetime energy cost for operation of a fan for blowing air through a length of duct is:
E = 1.8×10⁻⁷ x L x Q2.75 x t x U / (η x D4.75)
Where
E = lifetime energy cost ($)
L = duct length (ft)
Q = air flow (cfm)
t = duct lifetime (years; eg, 100 years)
U = utility energy cost ($/kWh; eg, $0.12/kWh)
η = fan-motor efficiency (eg, 0.2)
D = duct diameter (inches)
Life Cycle Cost (LCC) Relation:
The LCC based on the previous duct relations, and assuming negligible time value of money is the sum of lifetime duct operation cost and duct installation cost.
LCC = E + I
Where
LCC = life cycle cost ($)
E = lifetime energy cost ($)
I = duct installation cost ($)
Optimum Duct Diameter:
An expression for the most economical duct diameter can be derived from the LCC relation. The optimum diameter is the one that minimizes the LCC relation, that is, minimies the sum of lifetime energy cost and installation cost.
Dopt = [(8.55×10⁻⁷ x Q2.75 x t x U)/( η x β)]0.174
Where
Dopt = optimum duct diameter (inches)
Q = air flow (cfm)
t = duct lifetime (years)
U = utility energy cost ($/kWh)
η = fan-motor efficiency
β = duct installation cost parameter ($/ft-in)