


Eastern North Americans had been spectators over the past few years as devastating west coast wildfires filled western North Americans’ lungs with smoke. This year is different as “easterners”, anyone east of the continental divide, are participants in climate change’s whack-a-mole destruction of our health, homes, and livelihoods.
Build Equinox regularly receives calls and emails from concerned homeowners, builders and designers around North America, as smoke blankets their communities, asking how to manage indoor air quality during these more frequently occurring exceptional events. Bad advice, such as turning off ventilation units, spreads at internet speed. Air quality management requires more than shoot-from-the-hip guessing.
We have investigated particulate impacts on indoor environments for many years. This article provides guidance for managing indoor particulate concentrations, whether or not you have a CERV smart ventilation system, another type of ventilation system, or perhaps no ventilation at all.
Here is a list of actions for reducing indoor particulates during high outdoor particulate events (wildfire, wind driven dust, industrial exhaust, etc).
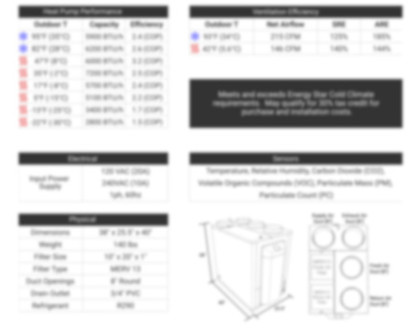
1) Maintain filtered (MERV13 or better) fresh air supply to the home, keeping carbon dioxide near 800ppm. Filtered fresh air is a must! As expressed by Florence Nightingale more than 100 years ago, without fresh air, all else is for naught.
2) Seal the building as best as possible to reduce uncontrolled outdoor particulate flow into the home. Window sealing kits are beneficial. Caulk, cord seal, tape, and foam seal as much as possible all around the home. It’s like picking up pennies; each one doesn’t add up to much but keep at it and you’ll have jarful that does.
3) Reduce exhaust air flow from the house. Exhaust ventilation lowers indoor air pressure, increasing infiltration and particulate flow into the house.
4) Positive balance fresh filtered air flow to further reduce infiltrated particulate flow into a home. Better sealed homes require less positive unbalancing than leakier homes, but all homes will benefit by increasing fresh filtered air flow. Ideally, supply fresh filtered air to maintain CO2 at 800ppm.
5) Homes with ducted central HVAC systems with MERV13 or better should continuously recirculate air. Particulate removal rate increases with higher fan speeds.
6) Add additional air recirculation and filtration units to your home as needed to further lower indoor particulate concentration. Units with CADR (Clean Air Delivery Rate) of 200 (cfm) should make a measurable impact to a room’s particulate concentration. Be sure to check the price of replacement filters! MERV13 and better filters should cost $10 or less. Cheap room filter units, like inkjet printers, often make their money on expensive, consumable filters. “Washable” filters are difficult to properly sanitize and dry and may create other health problems (mold and bacteria growth).
7) During these extreme outdoor particulate events, if you continue to suffer from the impacts of particulates, wear an N95 or equivalent mask until the event passes.
Modeling Indoor Particulate Concentration
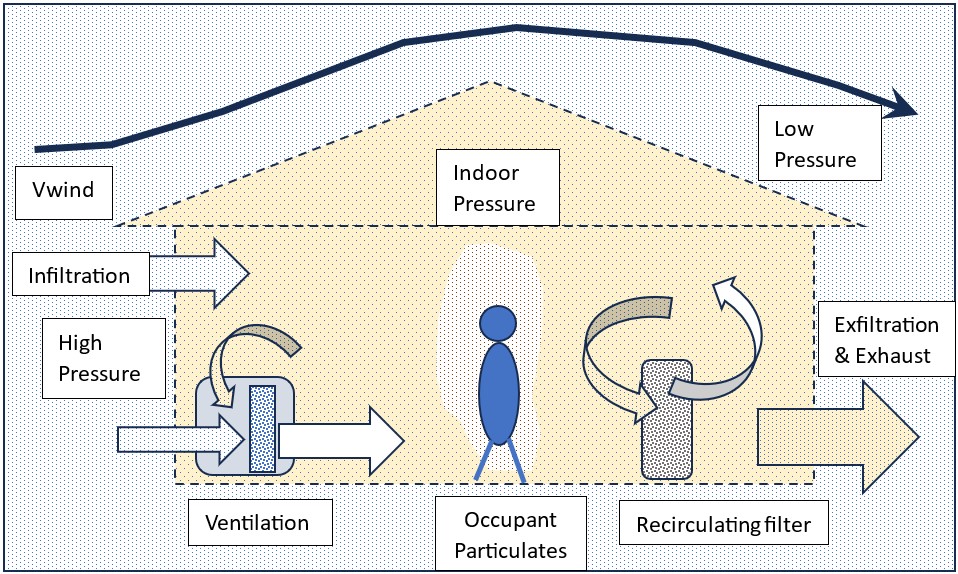
Indoor particulate concentrations are impacted by a home’s leakiness, indoor particulate generation, outdoor particulate concentration, wind speed, ventilation system, and air filtration. Figure 1 is a conceptual model of these factors. Our objective is to understand how to reduce indoor particulate concentrations as much as possible.
Everything we do inside buildings generates particulates. A human sitting quietly is a fountain of particulates from skin shedding, clothing abrasion, re-release of particulates accumulated on our clothing, and respiration aerosols. In addition, cooking, cleaning, exercising, and almost any other activity adds more sources of particulates to the indoor environment. From our research measurements, we find particulate generation to range from 100,000#/minute to 10,000,000#/min per person, depending on occupancy and occupant activities. Smoking, vaping, and poorly ventilated wood-burning fireplaces cause much higher indoor particulate generation rates.
Outdoor particulate levels range from almost nothing, such as after a rain shower, to concentrations that are visible as with wildfire smoke. Dry, windy regions create high particulate concentrations. Agricultural areas, such as central Illinois, experiences high outdoor particulates during fall harvesting and spring field work. A “normal” high outdoor particulate concentration would be “PM10” (all particulates 10 microns and smaller) of 50µg/m3 while visible wildfire smoke may reach 500µg/m3.
We can determine indoor particulate concentrations for a house by knowing a home’s ACH50 (blower door “air changes per hour” at 50Pa pressure difference), wind speed, ventilation system air flow, and filtered recirculation air flow. Unknown parameters to be determined from the Figure 1 conceptual model are infiltration air flow, exfiltration air flow, and indoor air pressure. We do not present the mathematical model here, but the basis for this model can be found in our Ductology report, Part 2 (see App G, p37).
The mathematical model is non-linear and implicit, with solutions taking us in different directions as parameters such as wind speed and ventilation flow rates are altered. This is why “shooting-from-the-hip” guessing is not good. Increase of one factor may be beneficial in one circumstance, but bad if one keeps increasing that parameter.
Our guidelines are meant to provide actions that are valid for homes whether they are large or small, leaky or sealed, and with varying types of air ventilation and recirculation systems. A 1000sqft home with 2 bedrooms is used as an example to show trends in indoor particulate concentration. We examine “leaky” (10ACH50) to highly sealed (0.5ACH50) with differing ventilation systems (exhaust ventilation, supply ventilation, balanced ventilation) and differing levels of recirculation and filtration. Trends we find for our example home apply to other size homes, but with differing levels of indoor particulates.
Discussion of Indoor Particulate Concentration Modeling Results
Most homes in the US are not ventilated. According to ASHRAE 62.2 residential ventilation standard, the 1000sqft, 2 bedroom example home should have a minimum ventilation of 52.5cfm (cubic feet per minute). ASHRAE 62.2 allows exhaust ventilation, supply ventilation, and balanced ventilation, which are not equivalent in terms of their impacts on our health.
Build Equinox newsletter readers know that we recommend significantly more ventilation than ASHRAE 62.2, but only when a house is occupied! With CERV2 smart ventilation, home occupants receive higher ventilation air flow when needed, and lower air flow when not needed. ASHRAE’s new 241 standard for reducing airborne disease transmission is a significant step to improving indoor environments, however it needs to become the normal standard and not the exception.
Figures 2 (Case 1), 3 (Case 2), and 4 (Case 3) show our modeling results for:
• Case 1 Example home under typical outdoor and indoor particulate conditions (Figure 2) with PM10 = 50µg/m3 outdoor ambient; 10 million particulates per minute indoor generation and 4mph wind speed
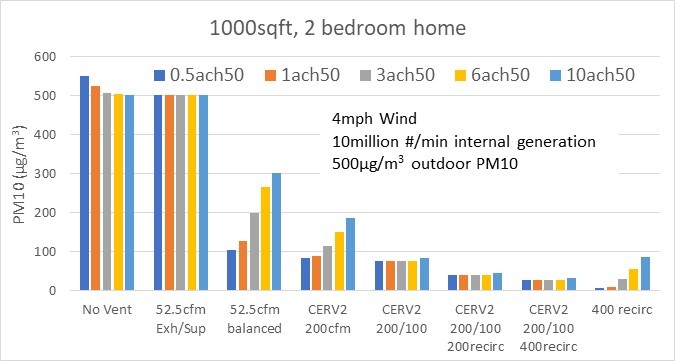
• Case 2 High outdoor particulate concentration events (Figure 3) with PM10 = 500µg/m3, 10 million particulates per minute indoor generation and 4mph wind speed
• Case 3 High outdoor particulate concentration events (Figure 4) with PM10 = 500µg/m3, 10 million particulates per minute indoor generation and 15mph wind speed
Case 1 – Indoor Particulates During Normal Outdoor Particulate Levels with 4mph Wind
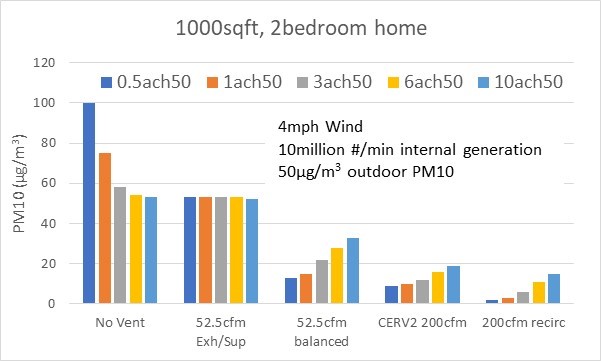
Figure 2 shows five ventilation scenarios for our example home constructed with 5 levels of leakiness. The leakiness levels represent the following home construction practices:
• Passive House (PH) level (0.5ACG50)
• Pretty Good House (PGH) level (1ACH50)
• Aggressive home builder (3ACH50)
• Standard construction (6ACH50)
• Older, standard construction (10ACH50)
Figure 2 shows homes without ventilation and without filtered recirculation will have indoor particulate concentrations that range from outdoor ambient particulate concentrations in leaky homes to much higher than outdoor particulate concentrations. Although air recirculation and filtration reduce indoor particulate levels, CO2 and VOCs are not reduced. Contrary to popular opinion, leaky homes have poor air quality in occupied rooms.
Case 1 assumes a “normal” wind speed of 4mph. Higher wind speeds bring more outdoor particulates into a home, which we will see for Case 3. The 1/20 rule-of-thumb for blower door measurements converts blower door test air flow rates to an infiltration air flow with a 4 to 5mph wind. For example, a home with 10ACH50 has an estimated 0.5ACH at “normal” (4-5mph) conditions.
Infiltrated outdoor air particulates are the primary particulates in the home as home leakiness increases above 3ACH50. Homes sealed to less than 3ACH50 are dominated by indoor generated particulates. Indoor and outdoor particulates are both bad for your health. Indoor particulates are composites of microbes, molds, allergens (dust mites, pet dander), and chemicals. Outdoor particulates are a soup of industrial pollutants, transportation exhaust, wildfire smoke, dirt, and biological matter.
Exhaust ventilation systems and unfiltered supply ventilation systems are infiltration enhancement systems that bring a home’s indoor environment closer to the outdoor environment. ASHRAE 62.2 ventilation for our example home (52.5cfm) for all levels of house sealing keeps indoor particulate concentration close to the outdoor ambient 50µg/m3 level.
Balanced ventilation systems, such as ERVs (energy or enthalpy recovery ventilators) and HRVs (heat recovery ventilators), operating at ASHRAE 62.2 conditions improve indoor particulate levels if the fresh air intake has an effective MERV13 or better filter. We see better sealed homes, such as Passive House and Pretty Good House homes, have lower indoor particulate concentrations because filtered ventilation air dilutes indoor particulates.
Increasing filtered fresh air flow into a home, such as the CERV2’s typical 200cfm, further reduces indoor particulate levels, as seen in Figure 2. The CERV2’s substantially greater than ASHRAE 62.2 ventilation supplies fresh filtered air that offsets indoor particulate generation and infiltration of unfiltered outdoor air.
The final house condition shown in Figure 2 shows how a home with whole house air recirculation and filtration further lowers indoor particulate concentration. In very well-sealed PH and PGH homes, particulate concentrations can be lowered well below Build Equinox’s PM10 < 10µg/m3 and PC0.3 < 40,000#/liter IAQ Standard.
CERV2 (and first gen CERV) smart ventilation systems operate in both fresh air ventilation and whole house recirculation modes 24/7. Under typical conditions, a CERV2 is in fresh air ventilation for 20% of the time and in whole house recirculation for 80% of the time. This balance is dynamic, with some extended time periods requiring 100% fresh air ventilation (eg, mealtimes), followed by an extended periods of no ventilation (everyone out of the house) and whole house air recirculation and filtration.
Homes with CERV2 smart ventilation will have indoor particulate concentrations between fresh air ventilation and whole house recirculation particulate concentration levels. Even very leaky homes with 6 to 10ACH50 benefit substantially from CERV2 operation in comparison to other common ways to manage house indoor air quality.
Case 2 – Indoor Particulates During High Outdoor Particulate Events with 4mph Wind
There is nowhere to escape wildfire smoke blanketing a region. We must sadly learn to manage these events more frequently. The respite our west coast neighbors are enjoying this year is unfortunately providing moisture needed to grow new fuel for future wildfires. Michigan’s “Thumb Fire” in the late 1800’s was one of the deadliest fires in US history (along with others in the Midwest), and is a lesson that deadly fires can happen anywhere.
Case 2 assumes outdoor particulate concentrations are elevated to 500µg/m3, representing a hazy, eye irritating, throat scratching, lung choking level of pollution dangerous to all, including our pets. The no ventilation case, similar to Case 1, elevates indoor particulate concentrations to unhealthy levels. Indoor particulate generation contributions are still important, just dwarfed in comparison to wildfire smoke. No ventilation is bad!
Exhaust ventilation and unfiltered supply ventilation systems for Case 2 maintain indoor particulates at unhealthy outdoor particulate concentrations. ASHRAE 62.2 (52.5cfm) balanced ventilation systems with effective fresh air filters (MERV13+) helps reduce indoor particulate concentrations, but we can do much better.
Figure 3 shows CERV2 200cfm increased ventilation air flow further reduces indoor particulate levels! Let’s repeat this; increasing ventilation air, if it is effectively filtered, reduces indoor particulate concentrations! We assumed MERV13 filters to remove 85% of wildfire smoke particulates from fresh air, reducing outdoor particulate concentration from 500µg/m3 to 75µg/m3 concentration. A MERV16 or HEPA with 90% single pass filtration would reduce fresh air particulates to 50µg/m3.
If wildfire smoke contains significant levels of VOCs, adding carbon filters to both fresh air and recirculation air filters helps absorb VOCs out of house air. For increased VOC absorption capacity, stack one or two “pure carbon” filters on top of CERV2 MERV13 fresh air and return air filters.
Positive pressure balancing further reduces infiltration particulate flow into a home by elevating indoor pressure. With a few menu button selections on your phone, a CERV2’s supply fan and exhaust fan can be offset during high outdoor particulate events. In Figure 3 we show 200cfm of fresh air flow with 100cfm of exhaust airflow. All homes display a significant reduction toward 75µg/m3 particulate concentration, the filtered fresh air particulate level.
For all homes except the leakiest with 10ACH50, positive pressure balancing reversed infiltration to exfiltration, producing a barrier to outdoor particulate infiltration. In effect, indoor air pressure has been elevated above the dynamic pressure of wind on the windward side of the house. Although the leakiest home still has some particulate infiltration, indoor particulate concentrations are also significantly reduced.
We add air recirculation and filtration as a final step. The next two sets of bar graphs show the impact of 200cfm and 400cfm of air recirculation and filtration through a MERV13 filter combined with a positively balanced CERV2 operating with 200cfm of fresh filtered air flow and 100cfm of exhaust air flow. As recirculation and filtration are increased, indoor particulates are further reduced to 20µg/m3 under severe indoor particulate generation and outdoor ambient particulate concentrations.
Finally, Figure 3 shows unventilated homes with 400cfm of recirculation and filtration air flow. Although the sealed homes (3ACH50 and lower) are further reduced in particulates, CO2 and VOC levels will be at unhealthy levels. Trading low particulates for high CO2 and VOCs is a choice we do not need to make. Filtered fresh air ventilation coupled with recirculation and filtration can be combined to give us control over CO2, VOCs and particulates.
Case 3 – Indoor Particulates During High Outdoor Particulate Events with 15mph Wind
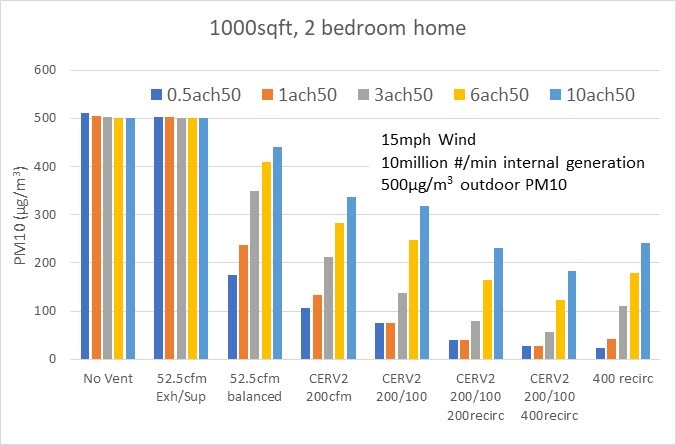
Elevated wind speed increases infiltration and exfiltration as the wind’s increased “dynamic pressure” against the home’s windward side drives air through leakage paths at an increase flow. Increased infiltration increases the flow rate of particulates into a home. At elevated wind speed, leaky homes become much more difficult to control than Passive House and Pretty Good House homes (<1ACH50).
Figure 4 shows that unventilated and ASHRAE 62.2 exhaust only and supply only ventilated homes are essentially at the same particulate concentration as outdoor air. Balanced ASHRAE 62.2 ventilation with MERV13 filtered fresh air reduces particulates, however, indoor concentrations remain undesirably high.
CERV2 fresh air ventilation air flow (200cfm) further reduces indoor particulate levels, and positive balancing of fresh air to 200cfm versus exhaust air at 100cfm reduces indoor particulate levels to the same level as Case 2 for the Passive House and Pretty Good House homes at lower wind speed.
Figure 4 shows that the PH and PGH homes are maintained at the same particulate concentration as Case 2 with lower wind speed with 200cfm and 400cfm of recirculation and filtration added to positive balancing of ventilation air. Leaky homes (>3ACH50) are improved by positive air flow balancing and increased levels of air recirculation, but indoor particulate concentrations remain undesirably high. Further increasing filtered fresh air flow will help restrict infiltration flow of particulates as well as increased recirculation and filtration. High recirculation and filtration air flow with no ventilation is ineffective and produces poor air quality. Although PH and PGH homes have lowered particulate densities, air quality will be very poor due to elevated CO2 and VOCs. Fresh air ventilation must be maintained regardless of outdoor particulate levels.
Summary
Our 7 steps for indoor particulate management should be followed in all homes. In general, the better sealed a home, particulate management is easier, but remember that well-sealed homes without proper ventilation of fresh filtered air are worse than leaky homes.
Indoor particulate management is complex as seen in our example results, but the trends discussed are not magic. Conceptual understanding of indoor particulate concentration variations does not require an understanding of the mathematical analysis.
You can improve your indoor environment during wildfire and other high outdoor particulate pollution events regardless of your home’s construction!